Download
1 / 32
320 likes | 330 Views
Model Validation of Transit Ridership at the Corridor and Transit Route Level. by Mark Charnews October 19, 2006. Reasons for a Validation of the Regional Travel Demand Model at the Corridor and Transit Route Level. Validate Travel Demand Model Transit Component to a greater level of detail.

E N D
Model Validation of Transit Ridership at the Corridor and Transit Route Level by Mark Charnews October 19, 2006
Reasons for a Validation of the Regional Travel Demand Model at the Corridor and Transit Route Level • Validate Travel Demand Model Transit Component to a greater level of detail. • Use the Regional Model for Transit Corridor Analysis by the Regional Council • Determine if Regional Model can be used by local transit agencies, who may not have the resources to develop, maintain and run their own models, to do their own corridor analysis. • Provide a model for consistent transit studies for all local transit agencies.
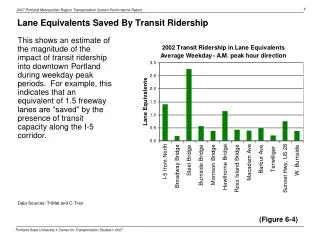
Regional Transit Monthly Ridership • Ridership has been reasonably stable from 1999 to 2005 with a slight decline between the start of 2001 and the end of 2003 that coincided with a small economic downturn in the region. Current ridership near or at 2000 levels.
King County Metro (MetroKC) • MetroKC is the largest transit agency, with over 70 percent of total transit ridership in the area.
Other Transit Agencies’ Monthly Ridership • A small decline in ridership occurred for each agency due to an economic turndown and current ridership has mostly recovered to year 2000 levels. • New Sound Transit Service took ridership away from MetroKC, Pierce and Community Transit.
Bus Travel Times • AM Peak Service ttfs: Local Bus Service ft11 = 1.5708 * timau .min. (length * 12) Express Service ft12 = 1.53615 * timau .min. (length * 12) Park and Ride Service ft13 = 1.5125 * timau .min. (length * 12) Closed Door Service ft14 = timau • Transit times are related to congested highway times.
Bus Travel Times • Mid-day Service ttf: Local bus Service ft11 = 1.72431 * timau .min. (length * 12) Express Service ft12 = 1.60597 * timau .min. (length * 12) Park and Ride Service ft13 = 1.4375 * timau .min. (length * 12) Closed Door Service ft14 = timau
Comparison of Average Modeled Transit Times and Average Scheduled Times • Times are shorter than observed, transit speeds are faster.
Comparison of Average Modeled Transit Times and Average Scheduled Times
Comparison of Modeled and Observed Bus Route Times • Some outliers, many routes with different times depending upon which branch of the route is measured. Needs a careful manual match up for better accuracy.
Comparison of Modeled and Observed Bus Route Times • Better fit for mid-day service.
Modeled Daily Ridership Equation • Model only assigns a three hour AM peak and a six hour Mid-day period. Daily Ridership = 2.2327 * AM Ridership + 1.5643 MD Ridership • Based on Time of Day proportions from MetroKC data.
Daily Ridership by Company • MetroKC - Modeled 392,919 boardings, Observed 358,806 boardings.
Daily Ridership by Company • Pierce Transit - Modeled 40,733 boardings, 32,978 observed.
Daily Ridership by Company • Kitsap Transit - Modeled 15,277 boardings, Observed 11,712 boardings.
Daily Ridership by Company • Kitsap Transit – special case, each bus makes one trip in AM, one in PM passengers assigned to route for Bremerton Naval Yard. Modeled 2,025 boardings, Observed 529 boadings.
Daily Ridership by Company • Everett Transit - very small service area, highway and transit network too coarse, TAZs too large. Modeled 4,031 boardings, Observed 2,550 boardings.
Daily Ridership by Company • Community Transit - very poor fit, but total modeled ridership 19,844 boardings, observed 18,091 boardings is close.
Daily Ridership by Company • Community Transit did a major redesign of service. • Using Fall 2000 ridership, a much better fit is obtained. • Modeled: 14,681 boardings, Observed 12,392 boardings.
MetroKC Ridership by Service Type • Modeled 274,003 boardings, Observed 245,745 boardings.
MetroKC Ridership by Service Type • Modeled 100,609 boardings, Observed 95,166 boardings.
MetroKC Ridership by Service Type • Note R squared near to Community Transit (which has a lot of P&R service) R squared figure. • Modeled 18,307 boardings, Observed 17,894 boardings.
MetroKC Ridership by Route Distance • The difference between Modeled and Observed boardings was plotted against one way route time. • Low R squared suggests no bias in boarding estimation by route distance.
Conclusions • Overall a reasonably consistent fit between modeled and observed boardings by route. • Bus travel time estimation needs to be refined. • Higher resolution TAZ system and highway/transit network needed for entire region to truly capture all transit routes.
Future • Set dwell times as a function of boardings. • Examine path building parameters to see if better fit can be obtained. • Review these findings with local transit agencies. • Develop new zone system and higher resolution road network. • Suggestions?
Questions Mark Charnews PhD. Mcharnews@psrc.org Puget Sound Regional Council 1011 Western Avenue, Suite 500 Seattle, Washington 98104-1035