Download

1 / 24
240 likes | 560 Views
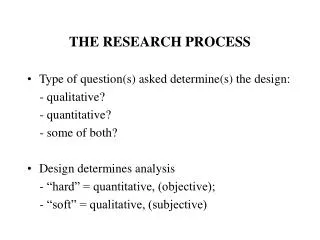
THE RESEARCH PROCESS. Type of question(s) asked determine(s) the design: - qualitative? - quantitative? - some of both? Design determines analysis - “hard” = quantitative, (objective); - “soft” = qualitative, (subjective).

E N D
THE RESEARCH PROCESS • Type of question(s) asked determine(s) the design: - qualitative? - quantitative? - some of both? • Design determines analysis - “hard” = quantitative, (objective); - “soft” = qualitative, (subjective)
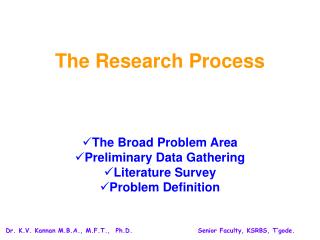
GETTING STARTED: Familiarity with the Literature • Goal:What has already been done? Who has done it? Assists in: - delimiting the research problem - identifying new approaches and trends - understanding and identifying methods Common to all scentific enquiry Continuum for depth of knowledge II passing knowledge thorough, in-depth knowledge
SOURCES - Indices, e.g. Education Index, Psych Abstracts, Science Citation Index - On-line searche.g. ERIC, Psych Abs., author name - Dissertations etc.e.g. Diss. Abs. Intl. and local - Bibliographies -Books, popular literature etc. ACTION - be open-minded - work backwards - contrast sources and type of knowledge - evaluate content over style: beware ‘common knowledge’ - keep review up-to-date - synthesise and reference FAMILIARITY with the LITERATURE
OBSERVE - e.g. what determines student behaviour/unit status in a given situation? - e.g. why is particular experiment/methodology less-than-satisfactory? - what can be learned by studying current practice? - why are some topics/measurements difficult to learn/make? DERIVE - inspiration from published work, e.g., seek to verify, replicate, refute - apply (existing) theory to (your) practice - resolve conflicting or contradictory findings - correct methodology in earlier work HOW to IDENTIFY a RESEARCH QUESTION(s)
AVOID - Unresearchable Topics Is the topic amenable to data collection and analysis? -Trivial Topics Relevance? - Overworked Topics Do you have a new slant? CONSIDER - Personal Factors Interested? Unbiased? Background and skills? Equipment, tools, participants, TIME? - General Factors Will the DATA be adequate, applicable, new, worth having? TOPIC CHOICE
PROBLEM FORMULATION/Some Common Mistakes • Poor definition of context - lack of theoretical or conceptual framework • Poor Basis - unsupported claims and assumptions • Data Collection- without defined purpose • Fitting Questions - to a “batch” of data • Poor Review of professional literature • “One-Shot” research - conducting research unique to a given situation, permitting no expansion/generalisation • Failure to make assumptions explicit, recognise limtations in approach, anticipate alternative explanations.
COMMON ERRORS in SELECTION • Availability - not “convenient” to sample/randomize • Population - not defined correctly (selecting participants/measuring units which are not appropriate) • Ignoring Design or MODEL - in obtaining sample, implementing conditions. • Compromising - too soon/not exploring the implications. • Volunteers/Common knowledge - what distinguishes volunteers from “non-volunteers”/ how good is common knowledge? • Size - too small/insufficient detail - attrition
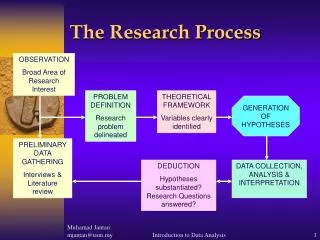
DESIGN - THE DATA PROBLEM -what are the issues? Questions Design Data Analysis • Type of questions being asked? • Logistics - size, feasibility etc. • Depth of knowledge? E.g. model assumptions, functional forms • Sourcing data - what are the difficulties? What are the key variables? Is it realistic/valid to generate data - what checks are built in?
Qualitative exploratory undirected investigator - “instrument” bias of investigator must be considered subjective analysis less formal, but hard to define - need a methodology Quantitative verify, refute: “evidence” shape/hypotheses - a priori investigator neutral investigator unbiased objective formal analysis THE APPROACH
Qualitative - Estimate time needed - how do you expect design to emerge from exploration you propose? - how many is enough? - what data will be initially collected? How will you handle data evolution? - topic, theory, methodology intertwined Quantitative - Estimate time needed - formulate hypotheses - define variables -internal/external validation -select participants - determine design which enables hypotheses to be tested - fixed at start/ reproducible STUDY DESIGN: Establishing Goals and Limitations
GENERATING/COLLECTING DATA MODE 1. Observation e.g. objective measurement or tally, evaluation of participants 2.Development e.g. quality metrics/tests/validation 3. Survey - both quantitative/qualitative. Data collection Records Interviews Questionnaires (accuracy?) (content/technique) (design) 3. Case Study - useful if context critical, but analysis convoluted - heuristic results/multiple sources 4. Simulation - probabilistic/deterministic- assumptions vital
TIPS for ANALYSIS of QUALITATIVE DATA • Devise plan for sorting through and organising large amounts of material • Analysis may require numerical aspects - see earlier • REMEMBER - tends to be heavily subjective; do not claim more than the data or design allow. • Abstract from the data to determine logical organisation e.g. if analysing a videotape, say, might “Identify” major theme shown by results, illustrate with actual data, but do not suppress adverse data, set up a multi-category encoding form, review tape action at specified intervals.
TIPS for ANALYSIS of QUANTITATIVE DATA • Keep it simple for exploration, but focus on hypotheses • Ensure software used is validated/interpretable • a range of possible techniques? Do not be afraid to use them. What are the assumptions underlying them? Think aheadat the design stage. Comparison important? Have you ensured equal precision? • Statistical inferences important? Non-parametric (smalkl numbers) vs parametric. Make sure estimating/testing what you set out to. What does significance imply? • Conclusions - relevant to questions posed?
ASSESSING THE QUALITY OF WHAT YOU DO - I • DATA ANALYSIS - Is it relevant and correct fortheDESIGN you have chosen? Have you succeeded e.g. in -identifying relationships/making predictions, obtaining correlations, describing causal patterns, disclosing differences (if these exist) between participants or groups or “treatments” or in substantiating that they do not? - is your evaluation of a method, programme or product comprehensive, able to stand up to further testing? - are your results reproducible, can they be expanded upon, do they add significant knowledge?
ASSESSING THE QUALITY OF WHAT YOU DO - II Internal Validity - how consistently can similar results be obtained for e.g. the participants, the setting, using simular techniques? • External Validity - are the results representative of the “world-at-large” • Data Verification e.g. replication (multiple data), e.g. riangulation (multiple perspectives)
QUALITATIVE - Internal Consistency (obtain independent comparisons/retain evidence) - credibility - trustworthiness - neutrality/bias? - extrapolation QUANTITATIVE - History/maturation - measurement changes, e.g. change of observer/scorer - incorrect selection/bias - missing data -real group differences (say) - not due to study ASSESSING THE QUALITY OF WHAT YOU DO - IIITHE THREATS TO VALIDITY
WHAT ARE KEY SUMMARY POINTS? • Background - major questions asked - conceptual basis/theory behind study - nature of the research/design • Research Methodology - characteristics of participants - procedures for selection of participants - characteristics of experiment - data collection tools and techniques (continued)
(continuing) SUMMARY POINTS • Results/Conclusions/Reactions - data reduction techniques, (e.g. statistical analysis) - interpretation of results and important comments of author - major conclusions and recommendations - implications of the findings - your reactions to aspects of study e.g. study rationale, conduct of study, data analysis or measurement used, researcher’s conclusions, other aspects of study design, relevance in context
SUPPLEMENT The following are supplementary to the first talk, and give a few pointers/ references for a quantitative approach using small numbers and non-parametrics/distribution-free techniques
QUALITATIVE - widest “variety” possible - plans for data collection will influence selection e.g. choose other people’s students e.g. include quantitative - plan use of all data collected and cross-checks QUANTITATIVE - define population what is the target population? - sample definition and compromises?? Implications? - varied data type / non-parametrics vs parametrics NUMBERS and APPROACH
Non-parametrics/Distribution Free-fewer assumptions/ ‘Quick and Dirty’ ABUSING e.g. STUDENT t -TEST common in parametric statistics/Estimate (and the rest) - non-normality(may be obvious, may be because sample sizes are too small to establish distributional basis) - type of dataless sophisticated in N-P (may be proportions or counts, may be measurements on ordered categories e.g.--, -,0, +,++) - parameters not of intrinsic interest (not interested in values of parameters or differences or ratios , but e.g. properties such as independence, randomness, ranking - parametric less useful than NP if conditions wrong
EXAMPLES • Scores recorded for 10 children on two subjects (Sign Test) A 19 11 14 17 23 11 15 19 11 8 Note:r = +ve = 4 B 22 18 17 19 22 12 14 11 19 7 s = -ve =6 - - - - + - + + - + r, s ~B(10, 0.5) For 2-sided test, 2Pr {r 4} = 0.75, so A and B results same • Students ranked as shown: (Spearman’s ) Psych. 9 1 7 5 8 6 2 4 10 3 D = (9-9)2 + (1-3)2 +... Stats. 9 3 10 2 6 7 1 4 5 8 ….+ (3-8)2 = 78 = 1- [6D/n(n2-1)] = 0.53 not significantly correlated
NP/DF Randomization type, e.g. runs test, 2, trend etc. Sign Test Rank Tests (Medians) Wilcoxon/Mann-Whitney, Kruskal-Wallis, Rank Correlation/(Regression) Normal Scores Kolmogorov-Smirnov (EDF) Parametric/Classical 2 test of proportions independent /matched pairs t-test t-test both paired and independent, ANOVA, Correlation,Regression Normal - based Estimation/C.I. -general PARALLELS with PARAMETRICS
NON-PARAMETRIC REFERENCES • Hollander M. “Nonparametric Statistical Methods” • Lehmann E.L. “Nonparametric Statistics based on Ranks” • Hajek J. “A course in Nonparametric Statistics” • Noether G.E. “Introduction to Statistics: A Nonparametric Approach” • Siegel S. “Nonparametric Statistics” • Sprent P. “Applied Nonparametric Statistics”