Download
1 / 23
280 likes | 586 Views
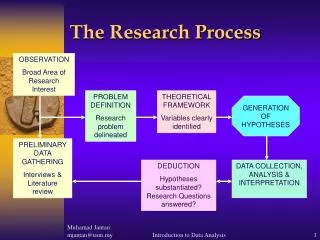
OBSERVATION Broad Area of Research Interest. The Research Process. PROBLEM DEFINITION Research problem delineated. THEORETICAL FRAMEWORK Variables clearly identified. GENERATION OF HYPOTHESES. PRELIMINARY DATA GATHERING Interviews & Literature review. DEDUCTION

E N D
OBSERVATION Broad Area of Research Interest The Research Process PROBLEM DEFINITION Research problem delineated THEORETICAL FRAMEWORK Variables clearly identified GENERATION OF HYPOTHESES PRELIMINARY DATA GATHERING Interviews & Literature review DEDUCTION Hypotheses substantiated? Research Questions answered? DATA COLLECTION, ANALYSIS & INTERPRETATION Introduction to Data Analysis
Data Analysis - Issues What is data analysis? Types of techniques Identifying the right technique Using computers to analyse data Reporting the analysis Introduction to Data Analysis
Testing Goodness of Measure Questionnaire Editing Data Entry & Data Definition Data Validation Editing the SPSS Output Syntax Command to SPSS Identifying the Right Technique Generating Composite Measures Transfer Edited SPSS output to Word File Interpreting the SPSS Output Report Writing The Data Analysis Process In most cases, the process is not sequential and linear, but more iterative where you may need to go back to some steps to explore further Introduction to Data Analysis
Data Analysis - Types Purpose of Study Exploratory; Test of Differences; Establishing Relationships Number of Variables Univariate; Bivariate; Multivariate Level of Measurements Nominal, Ordinal, Interval & Ratio Introduction to Data Analysis
Purpose of Study - Exploratory • Basically to address the issue of “Whatis the current situation – vis-à-vis the phenomenon of interest?” • Example: • What is the current level of innovation of Malaysian Companies? • What is the preferences of Malaysian consumers of organic food? • What percentage of the Malaysian consumers will use internet banking? Etc….. Introduction to Data Analysis
Purpose of Study – Test of Differences • To address the question of “Is there a difference between Type A and Type B in terms the phenomenon of interest, Y?” • Example: • Are companies in the electronics sector more innovative than companies in the food sector? • Are consumers in the professional line more likely to use internet banking compared to those in other occupation? • Is the preference for organic food higher for urban consumers compared to consumers living in the rural areas? Introduction to Data Analysis
Purpose of Study – Establishing Relationships • To address the question of “Is there a relationship between phenomenon X with phenomenon, Y?” • Example: • The larger the company, the more innovative it is? • The more business a company undertakes the more likely is the company to use internet banking? • The more the consumer believe that organic food is good for the health, the more likely he/she is to consume organic food. • The more secure is internet banking, the more user-friendly is the system, and the easier to access the system, the more likely a company is to use internet banking. Introduction to Data Analysis
Number of Variables - Univariate • Analysis involves only one variable • Exploratory studies typically involve univariate analysis • Example: • What is the current level of innovation of Malaysian Companies? • What is the preferences of Malaysian consumers of organic food? • What percentage of the Malaysian consumers will use internet banking? Introduction to Data Analysis
Number of Variables - Bivariate • Analysis involves two variables • Test of differences involves two variables • Establishing relationships may involve bivariate analysis (correlation) • Example: • Are companies in the electronics sector more innovative than companies in the food sector? – sector & level of innovation • The more business a company undertakes the more likely is the company to use internet banking? – size (in terms of business transactions) & likelihood of using internet banking Introduction to Data Analysis
Number of Variables - Multivariate • Analysis involves three or more variables • Analysis typical when trying to establish relationships • Example: • The more secure is internet banking, the more user-friendly is the system, and the easier to access the system, the more likely a company is to use internet banking. – security, user-friendliness, ease of access, and likelihood of using internet banking Introduction to Data Analysis
Data Types – Levels of Measurement Purpose of Study Exploratory; Test of Differences; Establishing Relationships Number of Variables Univariate; Bivariate; Multivariate Level of Measurements Nominal, Ordinal, Interval & Ratio Introduction to Data Analysis
Data Types - Levels of Measurements Introduction to Data Analysis
Nominal Scale Classificatory or Categorical e.g. Sex – Male/Female Colour Mutually exclusive & collectively exhaustive Introduction to Data Analysis
Ordinal Scale Categorize and rank e.g. Preference in job attributes Please rank from 1 most important to 5 least important the following attributes: Introduction to Data Analysis
Interval Scale Allows for measurement of distance between two points on the scale e.g. Preference in job attributes Using a scale of 1 (strongly disagree), 2 (disagree), 3 (neither agree nor disagree), 4 (agree) and 5 (strongly agree), please indicate the extent of your agreement by circling the appropriate number. Introduction to Data Analysis
Ratio Scale Has absolute zero; thus allowing for not only differences but also proportions in the differences e.g. Number of years in the organization Introduction to Data Analysis
The Right Technique? Research Question Concern for Central Tendency; Comparing groups; Relationships Number of Variables Univariate; Bivariate; Multivariate Level of Measurements Parametric and Non-parametric Introduction to Data Analysis
The Right Technique? What is the purpose of the analysis? What is the level of measurement? How many variables are involved? Introduction to Data Analysis
Descriptive Analysis Purpose: To describe the distribution of the variables of interest Answers the question of “What is ...?” Techniques Frequencies Distribution - if 1 ordinal or nominal variable, Cross-tabulation - if 2 ordinal or nominal variables Means - if 1 interval or ratio level variable Means of subgroups - if 1 interval or ratio level variable by subgroups Introduction to Data Analysis
Test of Differences Purpose: To evaluate the differences between 2 or more groups with respect to a variable of interest Techniques depends on Levels of Measurement of the Variable Number of Groups Independence of the Groups Introduction to Data Analysis
Nominal: 2 - test Ordinal: Friedman 2-way ANOVA Continuous: Factorial 2-way ANOVA Test of Differences More than 2 group? No Yes Are they independent? Are they independent? Yes Yes No No Nominal: 2-test Ordinal: Mann-Whitney Continuous: t-test Nominal- McNemar Ordinal - Wilcoxon Signed Rank Continuous: Paired t-test Nominal: 2 test Ordinal: Kruskal-Wallis ANOVA Continuous: 1-way ANOVA Introduction to Data Analysis
Relationship Purpose: To establish relationship between variables Techniques depends on Whether or not there exist dependent variable(s) Number of dependent and independent variables Levels of Measurement of the Variable Introduction to Data Analysis
Multiple Regression ANOVA Conjoint Analysis Dependence Relationships How many dependent variables? More than 1 One Scale of Dependent Scale of Dependent Nominal Scale of Independent Interval Interval Scale of independent Scale of Independent Scale of Independent Nominal Interval Interval Nominal Interval Nominal Discriminant Analysis Canonical Correlation Multivariate ANOVA Introduction to Data Analysis