Download
1 / 51
540 likes | 777 Views
Molecular Vibrations. http://www.cem.msu.edu/~reusch/VirtTxtJml/Spectrpy/InfraRed/infrared.htm. http://teaching.shu.ac.uk/hwb/chemistry/tutorials/molspec/irspec1.htm. Describe N atoms. Using cartesian coordinates specify movement on x, y, z axis for each atom

E N D
Molecular Vibrations http://www.cem.msu.edu/~reusch/VirtTxtJml/Spectrpy/InfraRed/infrared.htm
http://teaching.shu.ac.uk/hwb/chemistry/tutorials/molspec/irspec1.htmhttp://teaching.shu.ac.uk/hwb/chemistry/tutorials/molspec/irspec1.htm
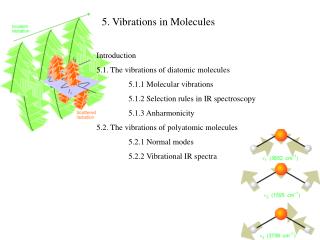
Describe N atoms • Using cartesian coordinates • specify movement on x, y, z axis for each atom • If joined as molecule, don’t move independently – some degrees of freedom are lost. • As a whole – molecule has 3 translational degrees of freedom • Non-linear – 3 rotational degrees of freedom • Linear – 2 rotational degrees of freedom
The remaining degrees of freedom are associated with vibrations • Non-linear molecule has 3 N-6 normal modes of vibration • Linear molecule has 3N-5 normal modes of vibration
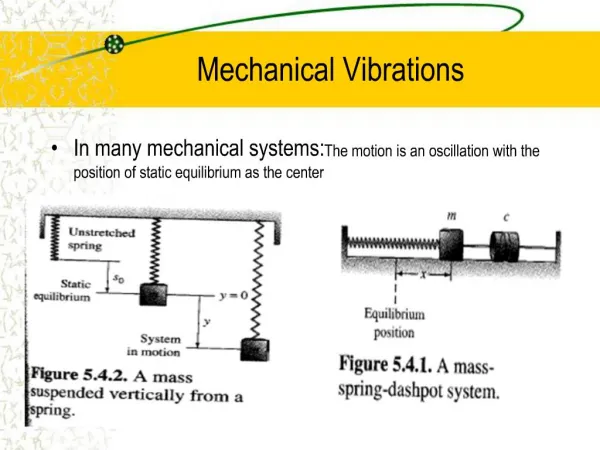
Simplest case – diatomic molecule • Model: spring with atoms at each end • Described by Hooke’s Law • force = f = -kx • The force constant k describes the stiffness of the spring • frequency = • µ = reduced mass = m1m2/(m1 +m2)
Quantum mechanics tells us there are only certain discrete vibrational energies in the molecules • Selection rule: 1
To absorb IR energy • A change in the magnitude and direction of oscillation of the dipole moment of the bond must occur. • Therefore number of bands observed is not equal to number of normal modes. • not all involve a change in dipole moment • some bands are degenerate
Other bands also occur • Weak bands, forbidden transitions, v > 1 • Called an overtone • Seen at double the vibrational frequency • Combination bands can also occur • Sum or difference of two frequencies • Occur when photon excites two modes simultaneously
Vibrational Coupling • eg Coupling between stretching occurs when there is an atom common to the two vibrations • A bend can couple with a stretch • Interaction is greatest if the coupled groups have almost equal individual energies
For all molecules with a centre of symmetry • A band allowed in the IR is forbidden in Raman, and vice versa.
Rotation is restricted in liquids and solids • get broadened vibrational peaks • In gas – vibration peaks are a series of closely spaced lines as a result of rotational levels
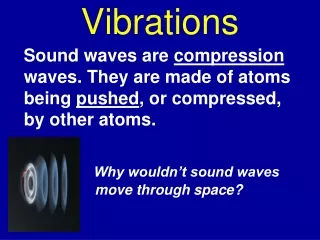
Source - Globar • Rod of SiC • about 5 cm 0.5 cm, heated by electric current • 1500 K • Very stable • Globar – a hot-body source • Imagine heating a piece of metal (blowtorch).As it warms, you feel heat from it (infrared).As you continue to heat it, it gets very hot.It starts to glow a deep red.Then bright red as it gets hotter.Then white hot, then blue.
The color of light emitted varies with temperature.Hotter => shorter wavelengths (more blue).When the piece of metal is as hot as the Sun (5800K), it puts out mostly visible light (peaked in yellow), like the Sun.This is why the Sun is the "color" that it is.Cooler objects emit light that is more red (or infrared).Our bodies emit radiation, infrared not visible.This behavior of objects is called Wien's Law.Hotter bodies radiate more strongly at shorter wavelength.
A hot, dense object will create a continuous spectrum following Wien's Law.Solid objects behave as blackbodies, they don't generate light by electron transitions, they use a different process (collision of atoms).Incandescent lights have a tungsten filament and emit a continuous spectrum.Stars are hot, dense objects which emit a continuous spectrum of light from their surface.
Pyroelectric detector • DTGS – deuterated tryglycine sulfate • accentric crystal with permanent dipole moment • Temperature change causes volume change which causes the dipole to change • The crystal is an insulator so charges on the surface do not immediately rearrange but instead produce an electric field which can be measured • Signal depends on rate of T change, not on T
The output from the detector is chopped or pulsed or otherwise modulated • Steady background radiation is ignored • Fast response time because it is affected by the rate of the temperature change, not the actual temperature
Photon detectors • MCT – mercury cadmium telluride • Semiconductor • Radiation is detected as a decrease in resistance • 5 more sensitive than DTGS • range smaller and less linear • must be cooled with liquid nitrogen to work
Incoming IR radiation raises electrons into the conduction band. • Resistance therefore decreases
Single beam instrument • In every scan, all source radiation gets to the sample! • The interferometer is a fundamentally different piece of equipment than a monochromater.
Fourier Transform Spectroscopy • Based on use of Michaelson Interferometer • System of mirrors and beam-splitter
In the Michelson interferometer the beam is split into two using a beamsplitter which allows 50% of the beam to pass through and reflects the rest. • The two beams are then reflected off mirrors and made to recombine again. • The phase of the beams is controlled by the difference in the path lengths of the two arms of the interferometer. • When this is an integral number of wavelengths, constructive interference occurs.
When the two beams meet up again at the beamsplitter, they recombine, but the difference in path lengths creates constructive and destructive interference: an interferogram • The recombined beam passes through the sample. The sample absorbs all the different wavelengths characteristic of its spectrum, and this subtracts specific wavelengths from the interferogram. • The detector now reports variation in energy versus time for all wavelengths simultaneously. • A laser beam is superimposed to provide a reference for the instrument operation.
Energy versus time is an odd way to record a spectrum, until you recognize the relationship between time and frequency: they are reciprocals! • A mathematical function called a Fourier transform allows us to convert an intensity-vs.-time spectrum into an intensity-vs.-frequency spectrum.
Nyquist frequency Data acquisition frequency must be twice the highest frequency of the signal of interest. You want to sample at least two data points per cycle.
The transmission spectrum is obtained by dividing the sample transform by the background transform. • Each interferogram is an average of a number of scans. Typically 32 scans. • Increasing the number of scans (N) increases the S/N ratio by a factor of N1/2
Advantages of FTIR • All of the source energy gets to the sample, improving the inherent signal-to-noise ratio. (Jaquinot advantage) • Multiplex advantage (Fellgett’s advantage) All light reaches detector at once – so you can get a spectrum in 1s. • The digitization and computer interface allows multiple scans to be collected, also dramatically improving the signal-to-noise ratio.
Most of the computer programs today allow further mathematical refinement of the data: you can subtract a reference spectrum, correct the baseline, edit spurious peaks or otherwise correct for sample limitations. Resolution is limited by the design of the interferometer. The longer the path of the moving mirror, the higher the resolution. Even the least expensive FT instrument provides better resolution that all but the best CW instruments were capable of.
Resolution depends on 3 factors: • Quality of optics • degree of collimation of radiation beam • length of mirror sweep – most important • Can have 0.1 cm-1 resolution • Called high resolution – and signal will be very jagged from noise
Filter instruments • Used in Process Analytical • Use gas of interest as filter • Cheaper and simpler
A rotating, gas-filled filter wheel contains two chambers. • One chamber is filled with the species of interest while the other contains an optically inert gas (i.e. Nitrogen). • Interferent species present in the gas sample attenuate both the sample and reference signals equally and will not be measured.
Gas Correlation AnalysisBars show the signals as the corresponding filter is in place
FT-IR-ATR • All samples are run in an attenuated total reflection (ATR) trough. The samples are put on a Zinc Selenide element. (displayed below)
Attenuated total Reflection • ZnSe crystal – refractive index greater than that of sample • The part of the light that penetrates into the sample is the evanescent wave. • The penetration depth is where the evanescent field decays to 1/e of the value at the interface.
Carbonyl stretching bands occur in the region 1800-1700 cm-1. • The bands are generally very strong and broad. • Carbonyl compounds which are more reactive in nucleophilic addition reactions (acyl halides, esters) are generally at higher wave number than simple ketones and aldehydes. • Amides are the lowest, absorbing in the region 1700-1650 cm-1.
Carbon-oxygen single bonds display stretching bands in the region 1200-1100 cm-1. • The bands are generally strong and broad. • You should note that many other functional groups have bands in this region which appear similar.
Alcohols and amines display strong broad O-H and N-H stretching bands in the region 3400-3100 cm-1. • The bands are broadened due to hydrogen bonding and a sharp 'non-bonded' peak can often be seen at around 3400 cm-1.
Alkene and alkyne C-H bonds display sharp stretching absorptions in the region 3100-3000 cm-1. • The bands are of medium intensity and are often obscured by other absorbances in the region (i.e., OH).
Carbon-carbon double bond stretching occurs in the region around 1650-1600 cm-1. The bands are generally sharp and of medium intensity. With identical trans substituents – signal is weak Cis substitution allows for bigger dipole, bigger signal Aromatic compounds will typically display a series of sharp bands in this region.