Download
1 / 43
440 likes | 611 Views
Dissecting the dynamics of transcriptional regulatory networks. M. Madan Babu Group leader. MRC Laboratory of Molecular Biology Cambridge, UK. Evolution of biological systems. Evolution of networks within and across genomes. Evolution of transcriptional networks.

E N D
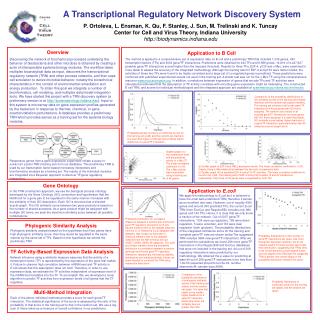
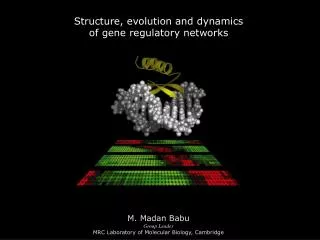
Dissecting the dynamics of transcriptional regulatory networks M. Madan Babu Group leader MRC Laboratory of Molecular Biology Cambridge, UK
Evolution of biological systems Evolution of networks within and across genomes Evolution of transcriptional networks Uncovering a distributed architecture in networks C H H PNAS (2008) Nature Genetics (2004) J Mol Biol (2006a) C Structure, function and regulation of biological systems Methods to investigate network dynamics Structure and dynamics of biological networks Principles of network dynamics Science (in press) Nature (2004) Submitted Data integration and function prediction Discovery of transcription factors in pathogens Discovery of novel DNA binding proteins Evolution of a global regulatory hubs Nuc. Acids. Res (2006) Nuc. Acids. Res (2005) J Bacteriol (2008) Overview of research
Outline Structure of the transcriptional regulatory network Global dynamics (network dynamics) of regulatory networks Local dynamics (node dynamics) of regulatory networks
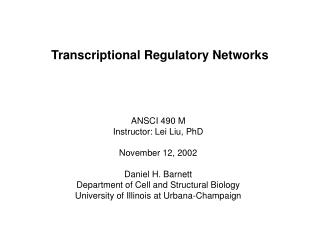
Network Metabolic Protein Interaction Transcriptional Proteins Nodes Links Metabolites Transcription factor Target genes Enzymatic conversion Physical Interaction Transcriptional Interaction Protein-Protein Protein-Metabolite Interaction Protein-DNA A A A A B B B B Networks in Biology
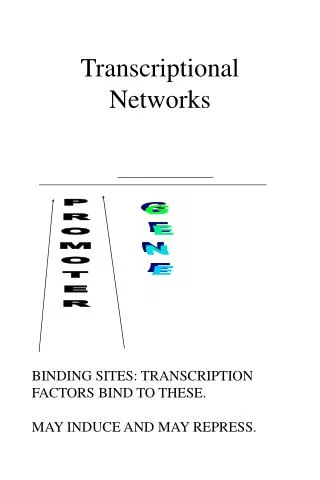
Basic unit Transcriptional interaction Global structure - Scale free network All interactions in a cell Local structure - Motifs Patterns of interconnections Transcription factor Target gene Basic unit Peptide link between amino acids Global structure Class/Fold Local structure Secondary structure Organization of the transcriptional regulatory network analogy to the organization of the protein structures
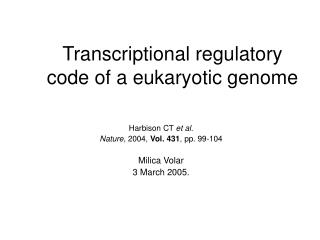
Single input Motif Multiple input Motif Feed Forward Motif ArgR TrpR TyrR Crp AroL AroM AraBAD ArgD AraC ArgE ArgF - Co-ordinates expression - Enforces order in expression - Quicker response - Integrates different signals - Quicker response Function - Responds to persistent signal - Filters noise Transcriptional networks are made up of motifs Network Motif “Patterns of interconnections that recur at different parts and with specific information processing task” Shen-Orr et. al. Nature Genetics(2002) & Lee et. al. Science (2002)
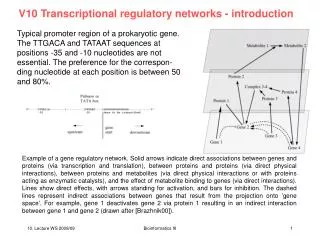
1 N (k) a g k Transcriptional networks are “scale-free” Scale-free structure Presence of few nodes with many links and many nodes with few links “Scale-free” structure provides robustness to the system Albert & Barabasi, Rev Mod Phys (2002)
Summary I – Structure of transcriptional networks Transcriptional networks are made up of motifs that have specific information processing task Transcriptional networks have a scale-free structure which confers robustnessto such systems, with hubs assuming importance Madan Babu M, Luscombe N et. al Current Opinion in Structural Biology (2004)
Outline Structure of the transcriptional regulatory network Global dynamics (network dynamics) of regulatory networks Local dynamics (node dynamics) of regulatory networks
Global dynamics of the regulatory networks Static regulatory network in yeast Cell cycle Sporulation ~ 7000 interactions involving 3000 genes and 142 TFs Across all cellular conditions Stress How does the local structure change in different cellular conditions? How does the global structure change in different conditions?
Regulatory program specific transcriptional networks Stress Binary Processes Regulatory programs involved in survival Diauxic shift DNA damage Cell cycle Multi-step Processes Regulatory programs involved in development Sporulation Sporulation Pre-sporulation Germination G0 G1 S G2 M E L M
Temporal dynamics of local structure Multi-step regulatory programs (development) Binary regulatory programs (survival) fast acting & direct fast acting & direct slow acting & indirect Network motifs that allow for efficient execution of regulatory steps are preferentially used in different regulatory programs
Hubs regulate other hubs to trigger cellular events Condition specific hubs Each regulatory program is triggered by specific hubs Permanent hubs Active across all regulatory programs This suggests a dynamic structure which transfers ‘power’ between hubs to trigger distinct regulatory programs (developmental & survival) Temporal dynamics of global structure (hubs)
multi-stage conditions binary conditions Diauxic shift DNA damage Stress Cell cycle Sporulation • more target genes per TF • shorter path lengths • less inter-regulation • between TFs • fewer target genes per TF • longer path lengths • more inter-regulation • between TFs Quick response Fidelity in response Sub-networks re-wire both their local and global structure to respond to cellular conditions efficiently Luscombe N, Madan Babu M et. al Nature (2004)
Summary II – Temporal dynamics of network structure Network motifs are preferentially used by different regulatory programs. This allows for efficient response to different cellular conditions Different regulatory proteins become global regulatory hubs under various cellular conditions. This allows for transition between regulatory programs by switching on condition specific hubs Luscombe N, Madan Babu M et. al Nature (2004)
Outline Structure of the transcriptional regulatory network Global dynamics (network dynamics) of regulatory networks Local dynamics (node dynamics) of regulatory networks
Dynamics in transcription and translation Each node in the network represents several entities (gene, mRNA, and protein) and events (transcription, translation, degradation, etc) that are compressed in both space and time
1 10 10 4 4 4 1 1 9 9 3 5 5 5 2 3 3 6 6 6 2 2 7 7 8 8 10 9 7 8 Higher-order organization of transcriptional regulatory networks Inherent higher-order organization Flat structure Hierarchical structure
Top layer Transcription Factor Topological Sort Core layer Bottom layer Target gene Target Genes ARG80 ARO80 AZF1 Level 7 CHA4 MBP1* SKN7* OAF1 MAC1 Top (25) DAL82 FLO8* MET31 HAL9 Level 6 NRG1* ABF1*◄ MAL33 MCM1◄ ZAP1 MET32 PIP2 ACE2 ADR1 AFT1* AFT2* ARG81 ASH1 CBF1* CIN5* CUP9 DAL80 DAL81 FHL1*◄ FKH1 FKH2* GAL4 GAT1 RDR1 ARR1 GAT3 GCN4* GLN3 GTS1 GZF3 HAP1 HAP4 HCM1* RLM1 PDC2◄ DAT1 Level 5 HMLALPHA2 HMS2 HSF1*◄ INO2 INO4 IXR1 LEU3 MGA1* Core (64) THI2 RTG1 MIG1 MIG2 MSN2* MSN4* NDT80 PHD1* PLM2* PUT3 UPC2 OTU1 RPH1 SMP1 SOK2* EDS1 RAP1*◄ REB1*◄ RIM101 ROX1 RPN4 SKO1 PHO2 YBL054W TOS8* TYE7 STE12* SUT1 SWI4* SWI5 TEC1* TOS4* YDR266C XBP1 YAP1 YAP5* YAP6* YAP7* YHP1 UME6* YOX1* YJL206C Level 4 RTG3 MET4◄ CAT8 HMS1 FZF1 ACA1 HAC1 YKR064W Level 3 HMRA1 HMRA2 PHO4 SPT23 STP1 PDR1 CUP2 CRZ1 CAD1 YRM1 RME1 SIP4 RGT1 SUM1 UGA3 ECM22 MAL13 CST6 LYS14 Bottom (59) Level 2 STP2 GCR1◄ YAP3 YDR026C MSS11 MSN1 MOT3 BAS1 PDR8 MET28 MIG3 PPR1 RDS1 RGM1 SFP1 PDR3 HMLALPHA1 IME2 Level 1 STB4 STB5 YRR1 WAR1 URC2 USV1 SFL1 YDR049W MATALPHA1 STP4 YER130C YER184C YML081W YPR196W SRD1 * Regulatory hubs ◄ Essential genes Hierarchical organization of the yeast regulatory network
Hierarchical organization of regulatory proteins Regulatory proteins are hierarchically organized into three basic layers Top layer (29) Core layer (57) Bottom layer (58) Target Genes Do TFs in the different hierarchical levels have distinct dynamic properties?
Transcript abundance (Holstege et al., 1998) Transcript half-life (Wang et al., 2002) (Yang et al., 2003) Protein abundance (Ghaemmaghami et al, 2003) Protein half-life (Belle et al, 2006 ) Transcript abundances for yeast grown in YPD (S. cerevisiae) and Edinburgh minimal medium (S. pombe) were determined by using an Affymetrix high density oligonucleotide array. Transcript half-lives were determined by obtaining transcript levels over several minutes after inhibiting transcription. This was done using the temperature sensitive RNA polymerase rpb1-1 mutant S. cerevisiae strain. Estimates of the endogenous protein expression levels during log-phase were obtained by TAP-tagging every yeast protein for S. cerevisiae. Protein half-lives were determined by first inhibiting protein synthesis via the addition of cyclohexamide and by monitoring the abundance of each TAP-tagged protein in the yeast genome as a function of time. Translational dynamics Transcriptional dynamics Datasets characterizing dynamics of transcription and translation
Regulation of transcript abundance or degradation does not appear to be a major control mechanism by which the steady state levels of TFs are controlled Regulation of protein abundance and degradation appears to be a major control mechanism by which the steady state levels of TFs are controlled Regulation of regulatory proteins within the hierarchical framework post-transcriptional regulation plays an important role in ensuring the availability of right amounts of each TF within the cell
Almost no noise Frequency Frequency Frequency Noisy Very Noisy No of copies No of copies No of copies Noise in protein levels in a population of cells Noise in a population of cells can be beneficialwherephenotypic diversity could be advantageous but detrimentalif homogeneity and fidelity in cellular behaviour is required 5 6 12 1 4 3 No. of copies of Protein i 3 8 1 3 9 1 19 2 7 10 0 8 Population of cells
Noise levels of regulatory proteins Top layer Core layer Bottom layer Target Genes Less noisy More noisy Regulatory proteins in the top layer are more noisy than the ones in the core or bottom layer
Individual 4 Individual 3 Individual 1 Individual 2 Differential utilization of the same underlying network by different individuals in a population of cells Noise in TF expression may permit differential utilization of the same underlying regulatory network in different individuals of a population Implication Underlying network
High variability in the expression of top-level TFs in a population of cells may confer a selective advantage as this permits at least some members in a population to respond quickly to changing conditions Gene network controlling sporulation Nachman et al Cell (2008) Noise in expression of a master regulator of sporulation in yeast
Summary III – local dynamics of regulatory networks Our results suggest that the core- and bottom-level TFs are more tightly regulated at the post-transcriptional level rather than at the transcriptional level itself Our findings suggest that the interplay between the inherent hierarchy of the network and the dynamics of the TFs permits differential utilization of the same underlying network in distinct members of a population
Conclusions May permit robust response to changing conditions by efficiently re-wiring the active regulatory network May provide flexibility in response in a population of cells, making the organism more adaptable to changing conditions Regulatory networks are dynamic within the timescale of an organism and the interplay between the global and local dynamics makes the network both robust and adaptable to changing conditions
Acknowledgements Nick Luscombe EBI, Hinxton, UK Raja Jothi S Balaji NCBI, NIH, USA Arthur Wuster Joerg Gsponer MRC-LMB, UK Mark Gerstein Haiyuan Yu Mike Snyder Yale University, USA Joshua Grochow Chicago University, USA L Aravind Teresa Przytycka NCBI, NIH, USA Sarah Teichmann MRC-LMB, UK MRC - Laboratory of Molecular Biology, UK National Institutes of Health, USA Schlumberger and Darwin College, Cambridge, UK
1. Identify strongly connected components (SCCs) 2. Obtain Directed Acyclic Graph (DAG) by collapsing the SCCs 3. Construct the transpose of DAG (reverse the direction of edges) 10 10 10 4 1 1 1 9 9 3,4, 5,6 3,4, 5,6 9 5 3 6 7,8 7,8 2 2 2 11 11 7 8 11 4a. Run iterative leaf-removal algorithm 4b. Run iterative leaf-removal algorithm 4b. Run iterative leaf-removal algorithm Layer 4 Layer 4 1 9 3,4, 5,6 7,8 Layer 3 Layer 3 11 2 3,4, 5,6 Layer 2 Layer 2 10 2 10 7,8 Layer 1 Layer 1 11 1 9 de 6. Combine to d u 7. Construct the final hierarchy 5. Invert the levels ce Layer 4 Layer 4 Layer 4 11 1 1 1 11 hierarchy 11 3,4, 5,6 3,4, 5,6 Layer 3 Layer 3 Layer 3 10 3 4 5 6 10 10 7,8 Layer 2 Layer 2 Layer 2 2 2 2 7,8 Layer 1 Layer 1 Layer 1 9 7 8 9 9 Topological Sort: An approach to infer hierarchical organization in networks Obtain Directed Acyclic Graph (DAG) by collapsing the SCCs Construct the transpose of DAG (reverse the direction of edges) Identify strongly connected components (SCCs) Invert the layers Construct the final hierarchy Run iterative leaf-removal algorithm Run iterative leaf-removal algorithm Combine to deduce the hierarchy
predator prey Applicable on cyclic networks Consistent ordering Scalable Allows for ambiguity (e.g. Mouse) Methods to infer hierarchical organization in networks Topological sort Food web network Leaf-removal algorithm BFS-level algorithm ? 6 5 4 4 4 3 2-4 3 3 2 2 2 1 1 1
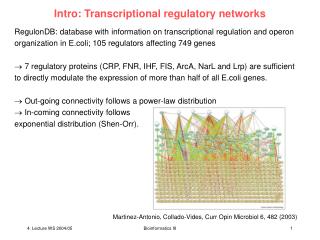
Transcription Factor (TF) Target gene (TG) Out-degree (#outgoing connections) = 81.4 On average, each TF regulates ~80 genes Yeast transcriptional regulatory network 156 TFs (regulatory proteins) 4,403 TGs (proteins being regulated) 12,702 links (regulatory interactions) In-degree (#incoming connections) = 2.9 On average, each gene is regulated by ~3 TFs
y = 43.706x-1.4426 R2 = 0.87 y = 1.8904x-0.7092 R2 = 0.57 Top y = 1E-08x3 - 8E-06x2 + 0.0015x + 0.0122 R2 = 0.47 Core y = 145.13x-1.8078 R2 = 0.92 Bottom Target Genes p < 10-4 Topological properties of regulatory proteins within the hierarchical framework
Top Core p < 0.041 Bottom Target Genes p < 3x10⁻³ p < 0.0644 p < 10-4 Genetic and Evolutionary aspects of regulatory proteins within the hierarchical framework
Cell cycle Sporulation Diauxic shift DNA damage Stress Temporal dynamics of global structure Condition specific networks are all scale-free Internal & multi-step regulatory programs (Development) External & binary regulatory programs (Survival) Do different proteins become hubs under different conditions? Is it the same protein that acts as a regulatory hub across multiple conditions?
Top layer Core layer Bottom layer Target Genes Top Layer (29) Core Layer (57) Unclassified (12) Bottom Layer (58) Higher-order organization in yeast regulatory network Transcription Factor (TF) Target gene (TG)
ARG81 MAC1 NDT80 ADR1 AFT2* ARG80 ASH1 AZF1 CAT8 CUP9 DAL81 DAL82 FKH2* GLN3 GTS1 HMS1 INO4 IXR1 LEU3 MAL33 MCM1◄ MIG1 MIG2 Level 4 OAF1 PDC2◄ PIP2 RPN4 SPT23 TOS8* TYE7 YAP1 Level 3 ABF1*◄ ACE2 AFT1* ARO80 ARR1 CBF1* CHA4 CIN5* DAL80 DAT1 FHL1*◄ FKH1 FLO8* FZF1 GAL4 GAT1 GAT3 GCN4* GZF3 HAC1 HAL9 HAP1 HAP4 HCM1* HMLALPHA2 HMRA1 HMRA2 HMS2 HSF1*◄ INO2 MBP1* MET31 MET32 MET4◄ MGA1* MSN2* MSN4* NRG1* OTU1 PDR1 Level 2 PHD1* PHO2 PHO4 PLM2* PUT3 RAP1*◄ REB1*◄ RGT1 RIM101 RME1 ROX1 RPH1 RTG1 RTG3 SIP4 SKN7* SKO1 SMP1 SOK2* STE12* STP1 STP2 SUM1 SUT1 SWI4* SWI5 TEC1* TOS4* UGA3 UME6* XBP1 YAP3 YAP5* YAP6* YAP7* YDR026C YHP1 YOX1* ZAP1 ACA1 BAS1 CAD1 CRZ1 CST6 CUP2 ECM22 EDS1 GCR1◄ HMLALPHA1 Level 1 IME1 LYS14 MAL13 MATALPHA1 MET28 MIG3 MOT3 MSN1 MSS11 PDR3 PDR8 PPR1 RDR1 RDS1 RGM1 RLM1 SFL1 SFP1 SRD1 STB4 STB5 STP4 THI2 UPC2 URC2 USV1 WAR1 YBL054W YDR049W YDR266C TFs with zero in-degree YER130C YER184C YJL206C YKR064W YML081W YPR196W YRM1 YRR1 * Regulatory hubs ◄ Essential genes A BFS-level algorithm on Yeast transcription network
Strongly Connected Component Level 3 OAF1 Level 2 UME6 Level 4 NDT80 Level 2 GAT1 Level 3 Level 4 ARG81 AFT2 Level 3 Level 2 AFT1 CUP9 Level 2 YAP6 XBP1 Level 1 IME1 RDS1 ACA1 YER130C RGM1 STB4 YML081W B An instance of inaccurate hierarchy as inferred by the BFS-level algorithm
Tolerant to random removal of nodes (mutations) Vulnerable to targeted attack of hubs (mutations) – Drug targets? Hubs are crucial components in such networks “Scale-free” networks exhibit robustness Robustness – The ability of complex systems to maintain their function even when the structure of the system changes significantly
Temporal dynamics of global structure (hubs) Connectivity profile: No of regulated genes Existence of condition specific hubs Each regulatory program is triggered by specific hubs Condition specific hubs Presence of permanent hubs across all regulatory programs Permanent hubs
Hubs regulate other hubs to trigger cellular events This suggests a dynamic structure which transfers ‘power’ between hubs to trigger distinct regulatory programs (developmental & survival)