Download
1 / 23
230 likes | 433 Views
Unraveling condition specific gene transcriptional regulatory networks in Saccharomyces cerevisiae. Speaker: Chunhui Cai. Background.

E N D
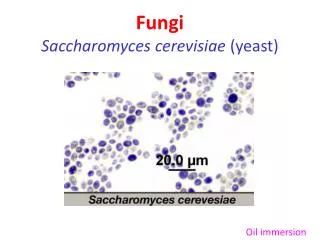
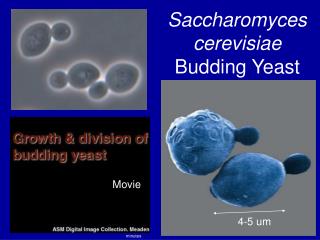
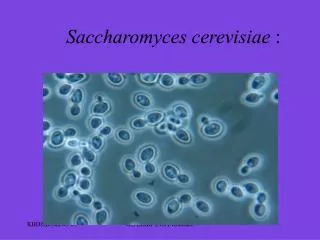
Unraveling condition specific gene transcriptional regulatory networks in Saccharomyces cerevisiae Speaker: Chunhui Cai
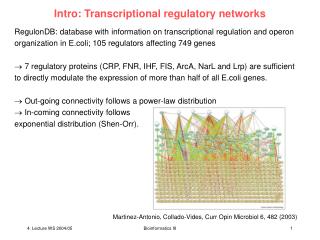
Background • Gene expression and transcription factors binding data have been used to reveal gene transcription regulatory networks. Existing knowledge of gene regulation can be presented using gene connectivity networks. However, these composite connectivity networks do not specify the range of biological conditions of the activity of each link in the network. • Therefore, it would be highly advantageous to develop a computational approach for predicting the biological conditions under which each regulator-target gene link in the known regulator network is active.
Background • The author presents an approach based on a variant of the signature algorithm to extend known transcriptional regulatory network. • United Signature Algorithm – USAIntegrates binding and expression information, enables us not only to identify new condition-specific transcriptional and regulatory interactions, but also predict the conditions in which each link in the known regulatory network is active.
• Infer the activity status of every link in the composite network at different biological states • Predict new regulatory links not present in the composite network at different biological states
Key issue – Predicting novel and condition-specific transcriptional regulatory interactions • The author integrates two complementary local network models for predicting: (a) new transcriptional regulatory interactions, (b) specific conditions in which experimental known and predicted interactions take place. • LINK model – based on the assumption that there is a correlation between the mRNA levels of a TF and its target gene under certain condition; • STAR model – deduce conditions of activity or inactivity of a TF from the correlation among its target genes.
Numerical result (Alon’s TR network) ** -- only for the binding sites that are conserved in at least three related yeast species.
Extracting condition-specific transcriptional regulatory networks • The authors aggregated the conditions from the gene expression compendium in to four categories: • Cell cycle; • Amino acid starvation • Rapamycin treated • Alpha-factor treated
Data types and sources • S. cerevisiae gene expression dataJ. Ihmels, S. Bergmann, and N. Barkai, "Defining transcription modules using large-scale gene expression data," Bioinformatics, vol. 20, pp. 1993-2003, 2004.The number of experimental conditions in this compendium is 1,011 of which we selected the 387 conditions associated with diploid cell. • S. cerevisiae transcriptional regulatory network (Derived from YPD database)R. Milo, et al, "Networkmotifs: simple building blocks of complex networks," Science, vol. 298, pp. 824-7, 2002.M. C. Costanzo, et al, "YPD, PombePD and WormPD: model organism volumes of the BioKnowledge library, an integrated resource for protein information," Nucleic AcidsRes, vol. 29, pp. 75-9, 2001.The TF-target pairs whose regulatory relationships alternate between stimulatory and inhibitory control are excluded. Genes missing from the expression data were also excluded, leaving us with 6,206 genes of which 115 are TFs. • Transcription regulatory binding motifs and probe sequences extracted from ChIP-on-chip experiments (to predict transcriptional regulatory interactions by calculating binding ratio and the associated P-value for each TF)C. T. Harbison, et al, "Transcriptional regulatory code of a eukaryotic genome," Nature, vol. 431, pp. 99-104, 2004. T. I. Lee, et al, "Transcriptional regulatory networks in Saccharomyces cerevisiae," Science, vol. 298, pp. 799-804, 2002. T. R. Hughes, et al, "Functional discovery via a compendium of expression profiles," Cell, vol. 102, pp. 109-26, 2000. • Standard symbols and aliases for genesH. W. Mewes, et al, "MIPS: analysis and annotation of proteins from whole genomes," Nucleic Acids Res, vol. 32 Database issue, pp. D41-4, 2004.MIPS Comprehensive Yeast Genome Database • Yeast promoter sequences dataC. T. Harbison, et al, "Transcriptional regulatory code of a eukaryotic genome," Nature, vol. 431, pp. 99-104, 2004.
Method – USA • The United Signature algorithm (USA) -- This algorithm is designed to find a subset of conditions in which the input genes are co-regulated, and to identify additional genes in that are potentially co-regulated under the same subset of conditions.
United Signature Algorithm • The order of the procedures performed in the USA: • bi-normalization and log transformation of the raw expression data (Egc);
2.selection of an input set of gene expression profiles consisting of the target gene and its TF(LINK MODEL), or the expression profiles of the target gene and all the other known regulated genes controlled by the TF(STAR MODEL); • For a TF target gene pair (e.g. TF Gene2) input expression profiles of the STAR or LINK model: i) all the known genes regulated by this TF (e.g. Gene2,4,6) ii) the TF – target gene pair
3. Invert normalized expression profiles of input genes with inhibitory relationship to the TF;Egc’ = wgEgc’ where wg is -1 if the regulatory relationship between the input gene g and the TF is inhibitory or +1 if it is stimulatory.
4. calculation of condition (column) scores by summing (or averaging) the columns of a sub-matrix, whose rows represent the normalized expression profiles of the input genes across all conditions; • 5. Derive a united transcriptional module condition set – Ω.where tc is a condition threshold value (tc = 1.5)
6. calculation of gene (row) defined as the weighted row average sg across the selected conditions c; • 7. determination of a sub-matrix of genes and conditions, termed the united transcriptional module (UTM);The genes are selected which satisfying the constraint:where tg is a gene threshold value (LINK MODEL – 4.0; STAR MODLE – 4.0)
8. Retain the genes whose pearson correlation coefficient with the target gene or the regulator satisfy |R| > α across the experimental conditions of the UTM. α = 0.5 (LINK MODEL); α = 0.7 (STAR MODEL) • 9. If needed (STAR MODEL), iterate steps 2 – 8 until all the genes in the final UTM are highly correlated with the target gene associated with the link of interest
LINK model • INPUT: • This model involves application of USA to each link in the known regulatory network, such that the list of input genes consists of the regulator and its target gene. • METHOD – USA: • To generate UTMs associated with each link we used condition and gene threshold of tc=1.5 and of tg=4.0 respectively.
FILTERING: • 1. The gene list is further filtered by keeping only those genes whose correlation coefficient with the regulator (or target gene of interest) satisfied |R|>0.5 across the experimental conditions of the UTM. • 2. The match between the position-specific weight matrix (PWM) of the regulator with the up stream intergenic region of each putative target gene and retain ed genes with a MATCH score equal or greater than a predetermined cutoff β (0.94).
STAR model • INPUT: • USA is applied to an input set of genes including the target gene of the LINK model and all the other target genes known to be regulated by the same TF (This model is only applicable when the number of target genes is equal or greater than 2).
METHOD – USA: • To generate UTMs associated with each link we used condition and gene threshold of tc=1.5 and of tg in a range of (3,4) respectively. • In order to obtain a cluster of highly correlated target genes, the authors used the following iterative elimination scheme: First, they obtained a UTM and computed all the correlations between its member genes across the conditions contained in the UTM. Then they identified a centroid gene that has the largest number of highly correlated genes. Input genes that are weakly correlated with the centroid gene were eliminated from the next iteration. USA is iteratively done until all the genes in the final UTM were highly correlated with each other (|R|>0.7).
FILTERING: • Genes that belong to the final UTMs that have a high matching score with their respective PWMs(0.94) are predicted to be targets of the corresponding TFs.
Discussion • De-composition of composite network to condition specific networks which contains both positive and negative interactions. • The predictions are based on the integration of a prior transcriptional regulatory network information with gene expression data as well as matching TF binding data. • For each regulatory link, we have a unique subset of conditions in which it is expected to active. • Each condition-specific ChIP-on-chip experiment is matched to expression profiles generated under the most similar experimental enviroment. • The author tried to deconvolution model combinatorial regulation between TFs, but the model led to results with low overlap with ChIP-on-chip data.