Download
1 / 19
190 likes | 307 Views
Mesoscale Group Meeting 25 January 2011. Frequency and distribution of sting jets in intense winter North-Atlantic cyclones. Oscar Martinez-Alvarado Sue Gray Laura Baker Peter Clark Department of Meteorology University of Reading. Shapiro-Keyser model of cyclogenesis.

E N D
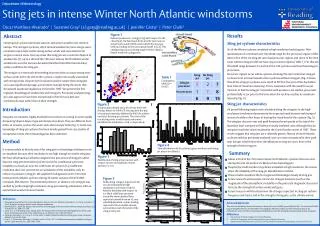
Mesoscale Group Meeting 25 January 2011 Frequency and distribution of sting jets in intense winter North-Atlantic cyclones Oscar Martinez-Alvarado Sue Gray Laura Baker Peter Clark Department of Meteorology University of Reading
Shapiro-Keyser model of cyclogenesis Browning (2004) after Shapiro and Keyser (1990)
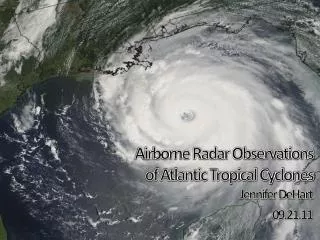
Sting Jets • Jet descending from mid-troposphere from the tip of the hooked cloud head • Located in the frontal fracture region • Mesoscale (~100 km) region of strong surface winds (that can reach more than 100 km/h) occurring in rapidly deepening extratropical cyclones • Transient (~ few hours), possibly composed of multiple circulations Shapiro-Keyser cyclogenesis Stage III Adapted from Clark et al. (2005)
Storm Anna:Sting jet history along trajectories A B Time series along Lagrangian trajectories following the sting jet showing the ensemble–mean (solid), ensemble-mean plus/minus one standard deviation (dashed) and instantaneous maxima and minima (dotted) of (A) pressure and (B) relative humidity. Figures adapted from Martínez-Alvarado et al. (2010b)
Overview of research path • Physical mechanisms for sting jets (SJ) (Browning 2004, Clark et al. 2005): Conditional symmetric instability (CSI) and evaporative cooling. • Study of CSI and SJ (Gray et al. 2011): Both updraught and downdraught CSI are present in SJ storms, DSCAPE is a good diagnostic to evaluate for SJ. • CSI in LAM and global models (Martinez-Alvarado et al. 2011): CSI produced but not realistically released in low-resolution models, DSCAPE can be used to evaluate for potential SJ. • DSCAPE in reanalyses (Martinez-Alvarado et al. 2011): Sting jets under present-climate conditions.
Physical mechanisms for SJ - I Mg increasing Downdraught SCAPE (DSCAPE) is the potential energy available to parcel to descend in slanted downdraughts Unstable slantwise convective circulations in an otherwise inertially and gravitationally stable atmosphere qe* increasing
Physical mechanisms for SJ - II:Conditional symmetric instability C A B Time series along trajectories following the sting jet showing the ensemble–mean (solid), ensemble-mean plus/minus one standard deviation (dashed) and instantaneous maxima and minima (dotted) of (A) moist potential vorticity, (B) moist static stability, and (C) absolute vorticity. Figures adapted from Martínez-Alvarado et al. (2010b)
CSI and SJ:Downdraught SCAPE A B Downdraught SCAPE (DSCAPE, in J/kg) at (A) 0100 UTC and (B) 0300 UTC on 26 February 2002. The bold dark line represents the edge of the cloud head; the grey lines are lines of constant wet-bulb potential temperature (in K). The black circle marks the position of the sting jet at each time (Gray et al. 2011).
CSI in LAM and global models A B Downdraught SCAPE (DSCAPE, in J/kg) at 0100 UTC on 26 February 2002 in (A) the LAM and (B) the global model. The bold dark line represents the edge of the cloud head; the grey lines are lines of constant wet-bulb potential temperature (in K). The black circle marks the position of the sting jet at each time (Martinez-Alvarado et al. 2011).
DSCAPE in reanalyses • ERA-Interim is the new ECMWF reanalysis covering the period 1989-present • Resolution: ~0.7° • This work looks at fields on pressure levels • Domain limited to 30°N - 70°N, 70°W - 30°E (North Atlantic and Europe) • 100 most intense cyclones during the full period in the reanalysis (1989-1998). • Only winter months (DJF)
Downdraught CSI and cyclone intensity (a) Frequency of cyclone occurrence (grey) and downdraught CSI regions (black) as a function of cyclone intensity (vorticity). (b) Percentage of downdraught CSI region to number of cyclones.
Inter-annual variability of frequency and intensity (a) Time series for intensity (vorticity) during cyclone life cycle. (b) Time series for frequency of the 100 most intense cyclones (gray) and downdraught CSI regions (black).
Location of downdraught CSIrelative to cyclone centres Mean positions (dots) and overall mean (cross) of downdraught CSI regions with respect to cyclone centres (a) and geographical coordinates and (b) cyclone travel direction
DSCAPE andvertical distribution Frequency of CSI regions as a function of (a) maximum DSCAPE and (b) maximum DSCAPE pressure
DSCAPE in individual cyclones ERA-Interim MetUM - global MetUM - LAM Start of trajectories - LAM
Individual analysis of cyclones Time series along Lagrangian trajectories following the sting jet showing the ensemble–mean (solid), ensemble-mean plus/minus one standard deviation (dashed) and instantaneous maxima and minima (dotted) of (A) pressure and (B) relative humidity.
Contingency tables • The contingency table after 15 verified cases • Including cases where the descent rate was > 0.3 Pa s-1 p-value = 0.034 (using Fisher’s exact test)
Summary • Mid-tropospheric regions of CSI have been shown to be very well spatially correlated with descending sting jets in mesoscale simulations of 3 sting jet storms (and are not present in a storm without a sting jet). • A DSCAPE-based method to detect sting jet precursors has been developed and has started to give results. • This method has being currently applied to the ECMWF reanalysis ERA-Interim. • 32 out of 100 most intense cyclones show signs of mid-tropospheric CSI. • A sample of 15 from the 100 most intense cyclones is being simulated at high resolution to verify the existence or non-existence of sting jets. • These results are to be published in Martínez-Alvarado et al. (2011), now in preparation.
References • Browning KA. 2004. The sting at the end of the tail: Damaging winds associated with extratropical cyclones. Quart. J. Roy. Meteor. Soc.130: 375–399. • Clark, P. A., K. A. Browning, and C. Wang, 2005: The sting at the end of the tail: Model diagnostics of fine-scale three-dimensional structure of the cloud head. Quart. J. Roy. Meteor. Soc., 131, 2263-2292. • Gray, S. L., O. Martínez-Alvarado, L. H. Baker, and P. A. Clark (2011) Conditional symmetric instability in sting jet storms. Submitted to Quart. J. Roy. Meteor. Soc. • Martínez-Alvarado, O., F. Weidle, and S. L. Gray (2010) Sting jets in simulations of a real cyclone by two mesoscale models. Mon. Wea. Rev, 138, 4054–4075. • Martínez-Alvarado, O., S. L. Gray, L. H. Baker, J. L. Catto, and P. A. Clark, (2011) Susceptibility of intense North-Atlantic extratropical cyclones to the production of sting jets. To be submitted to Quart. J. Roy. Meteor. Soc.