Download
1 / 44
440 likes | 696 Views
2002 Atlantic Intense Hurricanes ISIDORE and LILI. Pressure - Wind Relationships Intensity / Structure Satellite Images. LOWEST MINIMUM SEA-LEVEL PRESSURE (hPa) 1. Mitch 905 2. Opal 916 3. Floyd 921 4. Felix ‘95 929 5. Gert 930 6. Edouard 933 7. Lenny 933 8. Michelle 933

E N D
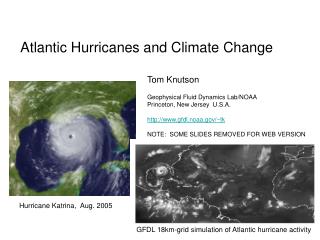
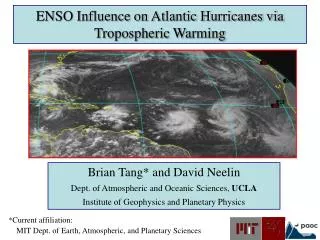
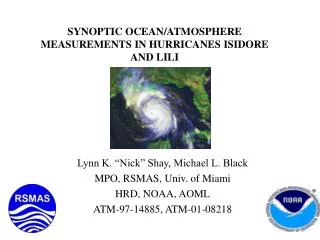
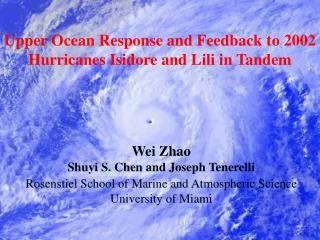
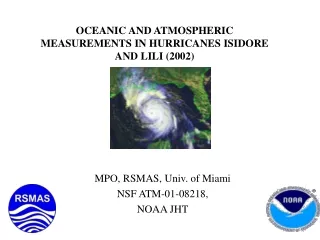
2002 Atlantic Intense Hurricanes ISIDORE and LILI Pressure - Wind Relationships Intensity / Structure Satellite Images
LOWEST MINIMUM SEA-LEVEL PRESSURE (hPa) 1. Mitch 905 2. Opal 916 3. Floyd 921 4. Felix ‘95 929 5. Gert 930 6. Edouard 933 7. Lenny 933 8. Michelle 933 9. Isidore’02 934 10. Luis 935 11. Hortense 935 12. Georges 937 13. Lili ’02 938 14. Keith 939 15. Cindy 942 MAXIMUM SURFACE WIND SPEED (knots) 1. Mitch 155 2. Georges 135 3. Floyd 135 4. Lenny 135 5. Opal 130 6. Gert 130 7. Edouard 125 8. Bret 125 9. Iris 125 10. Lili ’02 125 11. Felix ’95 120 12. Luis 120 13. Hortense 120 14. Cindy 120 15. Isaac 120 Ranked Lists of the 29 Atlantic Intense (Cat. 3+) Hurricanes during 1995-2002
16. Isaac 943 17. Bret 944 18. Fran 946 19. Erika 946 20. Iris 948 21. Marilyn 949 22. Alberto 950 23. Bonnie 954 24. Roxanne 956 25. Bertha 960 26. Isidore‘96 960 27. Lili‘96 960 28. Felix ‘01 962 29. Erin 968 16. Keith 120 17. Michelle 120 18. Erika 110 19. Alberto 110 20. Isidore’02 110 21. Fran 105 22. Erin 105 23. Marilyn 100 24. Roxanne 100 25. Bertha 100 26. Bonnie 100 27. Isidore’96 100 28. Lili ‘96 100 29. Felix ’01 100 Lists of the 29 Atlantic IH’s, 1995-2002…CONTINUED
1. Cindy 231 2. Luis 213 3. Erika 213 4. Floyd 201 5. Opal 188 6. Felix ’01 185 7. Fran 181 8. Isaac 163 9. Bertha 156 10. Bonnie 150 11. Georges 144 12. Isidore’02 144 13. Lili ’02 143 14. Hortense 138 15. Gert 138 16. Felix ‘95 135 17. Mitch 131 18. Roxanne 130 19. Edouard 125 20. Lili ‘96 125 21. Alberto 125 22. Michelle125 23. Lenny 124 24. Keith 115 25. Erin 113 26. Marilyn 105 27. Isidore‘96 90 28. Bret 78 29. Iris 69 ATL IH’s ranked by Size – R-34 kt (n. mi.)
Satellite Images comparing the Eye of Isidore and Lili at Maximum Intensity • GOES IR 4-km Mercator remapped, centered, zoomed by factor of 2 • MODIS 2-km Truecolor Visible - large area • MODIS 250-m Visible zoomed over eye
Radius of Maximum Wind (RMW) • From HRD Wind Analysis • USAF recon • Isidore – 20.7 km (11.2 n.mi.) • 0600-1145 UTC / 22 Sep • Lili – 14.7 km (8.0 n.mi.) • 1502-1829 UTC / 2 Oct
Radius of Maximum Wind (RMW) • -from “Extended Best Track” (DeMaria, CIRA) data (operational estimates): • Isidore – 10 n. mi. • Lili – 5-10 n. mi. -from Kossin (CIMSS) algorithm for RMW from IR images (R of –55C IR T) -Isidore – 12.0 km (6.5 n. mi.), 1145 UTC / 22 Sep -Lili – 12.5 km (6.8 n. mi.), 1845 UTC / 2 Oct
RMW Influence on P-Wind Relationship • For a given delta-p, smaller RMW is associated with a larger Vmax…..
“Shape of radial pressure curve” Influence on P-Wind Relationship • All other factors constant, a delta-p distributed through the eyewall wind maxima, as a “v-shaped” profile, will give a smaller Vmax than a “u-shaped” profile.
Influences of the Tropical Cyclone Pressure : Wind Relationship • Pressure : Wind = MSLP : Vmax • MSLP = minimum sea-level pressure • Vmax = maximum surface wind (10-m, 1-min wind) • 1) penv = environmental pressure • 2) RMW = radius of maximum wind • 3) Size (radial extent of gales, 34-kt) • 4) shape of radial profile of pressure/wind • 5) landfall effects
Conclusion on differences in Lili and Isidore’s P-Wind Relationships • They are likely due to a combination of all influences except: 3) Size • Different environmental pressure, different land mass influences on wind, different RMW’s and shape of pressure profile (Lili’s more u-shaped)
Animated IR -- Center Relative Average Images Each image is averaged over a 6-hr period using all available images. Images are created at 3-hr intervals.