Download
1 / 56
580 likes | 695 Views
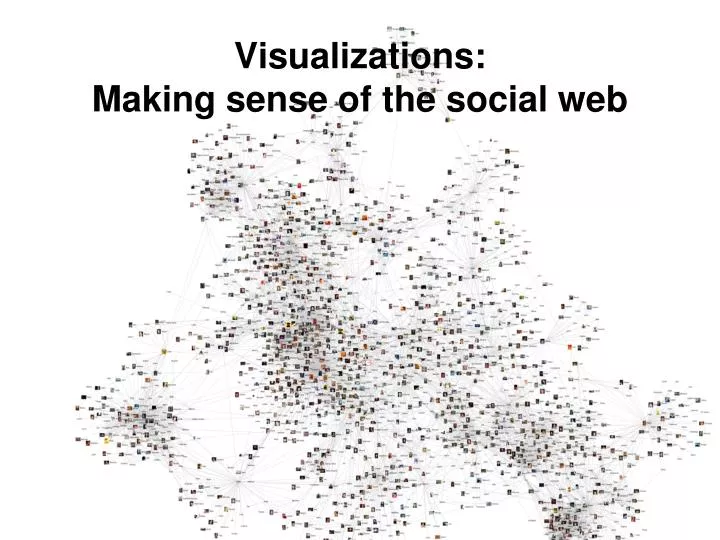
Visualizations: Making sense of the social web. Visualization for Eliciting Knowledge from Data. Visualization for Eliciting Knowledge from Data. The Power of Visualization. The Power of Visualization. Are these datasets the same?. Are these datasets the same?. Anscombe’s quartet.

E N D
7 Are these datasets the same?
8 Are these datasets the same?
9 Anscombe’s quartet
Using Visualizations for Social Web • Lots of examples today • Applying visualizations for specific domains • Some discussion of principles
What are the elements to visualize? • In a real-time chat room? • Frequency of posts • Aggregate or individual people • Common topics • Where they are posting (geolocation) • Relationship • Social network (who knows whom) • Use of user tools • How many people blocked, different UI elements used • Summaries • Who are the people here (a/s/l)
Chat Circles: Viegas & Donath, 1999 • Self-identification through • Color • Spatial position • Label • Overall activity: brightness of circle • Indicates both overall number of users and activity level • Zone of hearing • Localizes conversations
Chat Circles: Archival view • X-axis: people • Y-axis: time
What are the elements to visualize? • In an online discussion forum? • Common topics • Rate of response vs other variables • Length of time on site (newbie / old timer) • Interactions of different types • Ratings of posts vs comments • Gender / topic / smileys • Time of day / day of week • Scheduled tweets • Clickthrough/ level of interest
Loom (Karahalios & Donath) • Participant X Time matrix • View threading between participants Participant Time
Loom (Karahalios & Donath) Participant Time
Loom (Karahalios & Donath) Participant Time
Loom • Visualizing mood • Anger: caps, !?!!, profanity • Information: dates, cities, newsfeeds, etc. • Peaceful • Other • Same person-time axes as in other Loom view
Usenet (Smith et al.) • Usenet 2000
Usenet (Smith et al.) • Usenet 2004
Usenet (Smith et al.) • Growth in postings (e.g., alt.binaries) • Fairly steady reply rate; i.e., social interactions
microsoft.public.windows.server.general Days Active in Newsgroup Posts per Thread in Newsgroup
microsoft.public.windows.server.general • Size of circle is total number of posts • Red means has posted recently Days Active in Newsgroup Posts per Thread in Newsgroup
microsoft.public.windows.server.general • Who are these people? Days Active in Newsgroup Posts per Thread in Newsgroup
microsoft.public.windows.server.general • Who are these people? Days Active in Newsgroup Posts per Thread in Newsgroup
Taking a Step Back • Before talking about next section, useful to take a step back and think about good and bad visualizations
Variables You Can Manipulate Size Value Orientation Texture Shape Position (2D / 3D)
Appropriate Use of Color • Don’t use ROYGBIV for colors • Modify the saturation and/or intensity instead
Design Guidance Tufte • Tell the truth (baseline, scale, context) Lie Factor = size of effect shown/ size of effect in data
Design Guidance Tufte 2. Be careful with size coding (height/width v. area vs volume)
Smooth Transitions • Baby Name Wizard (http://www.babynamewizard.com/voyager#)
Shneiderman’s Mantra Overview First, Zoom and Filter, Details on Demand Overview First, Zoom and Filter, Details on Demand Overview First, Zoom and Filter, Details on Demand Overview First, Zoom and Filter, Details on Demand Overview First, Zoom and Filter, Details on Demand Overview First, Zoom and Filter, Details on Demand Overview First, Zoom and Filter, Details on Demand Overview First, Zoom and Filter, Details on Demand Overview First, Zoom and Filter, Details on Demand Overview First, Zoom and Filter, Details on Demand
InfoViz’s Can Show and Hide Info • US Election 2004 2004