Download
1 / 50
510 likes | 848 Views
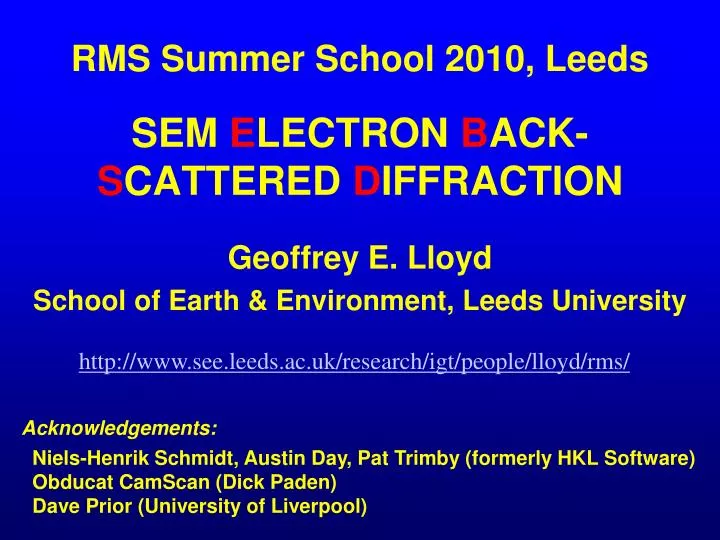
RMS Summer School 2010, Leeds SEM E LECTRON B ACK- S CATTERED D IFFRACTION. Geoffrey E. Lloyd School of Earth & Environment, Leeds University. http://www.see.leeds.ac.uk/research/igt/people/lloyd/rms/. Acknowledgements:

E N D
RMS Summer School 2010, LeedsSEM ELECTRON BACK-SCATTERED DIFFRACTION Geoffrey E. Lloyd School of Earth & Environment, Leeds University http://www.see.leeds.ac.uk/research/igt/people/lloyd/rms/ Acknowledgements: Niels-Henrik Schmidt, Austin Day, Pat Trimby (formerly HKL Software) ObducatCamScan (Dick Paden) Dave Prior (University of Liverpool)
Plan • Basic principals • EBSD pattern recognition • EBSD problems • Orientation contrast imaging • Automated EBSD analysis • Specimen requirements • EBSD applications • A few examples • Concluding remarks
incident electrons emitted electrons emitted electrons ‘lost’ electrons ‘lost’ electrons Electron:Sample Interaction Multiple scattering Single nucleus ‘focussed’ ‘unfocussed’
Effects of Scattering 2. crystalline materials: electrons are diffracted by the crystal lattice planes when the Bragg condition is satisfied 1. creates a ‘point’ source of electrons, with all possible trajectories, within the material note different lattice spacing
Scattering from single lattice planes Each lattice plane (hkl) gives rise to 2 diffraction ‘cones’ For SEM electron wave-lengths, opening cone angles are close to 180 (after A. Day)
(after J. Hjeiling) Scattering from 3D lattice planes • A 20keV electron beam strikes a sample tilted at 65-75° • The crystal structure at the point of incidence diffracts the electron beam according to Bragg’s law, nl = 2dsinq The image (EBSD pattern) is unique for the crystal orientation & composition at the point of incidence on the sample • Each lattice plane (hkl) gives rise to 2 diffraction ‘cones’ (after A. Day)
incident electron beam: 8-40kV, 0.01-50nA emitted electrons Specimen: Surface normal typically inclined 60°-80° to beam EBSD detector Camera Pattern processing low-light sensitive (now digital; originally analogue) Typical SEM EBSD set-up EBSD detector - position usually constrained by chamber geometry EBSD detector distance set to give ~90 ° angular range in EBSP
EBSD pattern recognition • EBSD patterns are unique for a specific crystal orientation • The pattern is controlled by the crystal structure: space group symmetry, lattice parameters, precise composition • Within each pattern, specific ‘bands’ (i.e. pairs of ‘cones of diffraction’) represent the spacing of specific lattice planes (i.e. dhkl) • EBSD pattern recognition compares the pattern of bands with an ‘atlas’ of all possible patterns in order to index the crystal orientation depicted • This process WAS manual – it is NOW automated ! • Example - next slide
pyrite FeS2 diffraction from specific lattice plane width = 1/d-spacing major crystal ‘pole’ HOLZ ring 1st order diffraction 2nd order diffraction EBSD Patterns • Unique for crystal orientation & composition at the point of beam incidence • Can be >100° of total crystal projection - easy to index as symmetry decreases • Spatial resolution (1m) • Some pattern details:
Computer indexed pattern Original pattern Example: pattern indexing manual/auto-indexed bands
Example: fcc (Cu) Example: trigonal (quartz) 0001 001 rotate 101 unit triangle 011 -2110 11-20 symmetrically equivalent unit triangle 111 -12-10 unit triangle EBSD pattern ‘range’ Determined by crystal symmetry – defines the crystallographic unit triangle that repeats the range of patterns over a sphere
Indexing requirements • SEM geometry: beam energy, specimen & detector positions & orientations usually fixed per SEM • Crystallography: sample lattice parameters & Laue/space group input per phase (i.e. composition) as required • Diffraction characteristics: relative diffraction intensities from different (hkl) lattice planes calculated per phase as required
1. Select a crystal e.g. aluminium Creating a crystal database 2. Input lattice parameters e.g. a = b = c = 0.405nm a = b = c = 90 3. Input crystal symmetry e.g. cubic Laue group = m3m Space group = 225 or Fm-3m 4. Input crystal unit cell symmetry indicates 4 atomic positions e.g.Atom x y z Occ Al 0 0 0 1 Al 0 0.5 0.5 1 Al 0.5 0 0.5 1 Al 0.5 0.5 0 1
To index EBSD patterns, we must know the relative intensities of the (Kikuchi) bands (reflectors) in the patterns Most approaches use the kinematic electron diffraction model This model calculates the structure factor (intensity) for each (hkl) reflecting plane: Create a diffraction database intensity of (hkl) plane number of atoms lattice planes structure factor for (hkl) plane atomic scattering factor atomic position of atom g
Diffraction database Conventional software packages automatically calculate the diffraction (reflector) database of (relative) intensities e.g. aluminium:
EBSD Problems Pseudo-symmetry Spatial resolution Angular resolution Specimen preparation - see later
Pseudo-symmetry • Occurs where 2 orientations cannot easily be distinguished due to an apparent n-fold rotation axis • Especially common in lower symmetry crystal structures: • e.g. the orthorhombic structure with a b can appear to be tetragonal when viewed down the c-axis • Specific examples (minerals): • quartz trigonal but can appear pseudo-hexagonal • olivine orthorhombic but can appear pseudo-hexagonal • plagioclase triclinic but can appear pseudo-monoclinic &/or pseudo- hexagonal
negative rhomb distinguishes positive rhomb Example Quartz: 60° rotation about the c-axis Often results in similar EBSD patterns Recognition depends on the identification of ‘minor’ bands (black) - often not selected automatically
Example: P R R P Spatial resolution • Depends on the penetration & deviation of electrons into a sample (plus beam diameter) • Typically ranges from ‘few’ mm for W-filament SEM to a few 100nm for FEG SEM • Penetration depends on: • sample atomic number • accelerating voltage • beam current • (plus, coating depth & surface damage - see later) note ‘down slope’ effect of tilting – scan ‘uphill’ Several Monte Carlo based simulation packages are available via the Web (e.g. http://www.gel.usherbrooke.ca/casino/index.html)
Angular Resolution Angular resolution of an individual EBSD pattern is typically ~1 Also important when determining the misorientation between two (adjacent) crystal lattices (e.g. grains) – ‘misorientation analysis’ is becoming a popular application of EBSD as it provides information on sample properties & behaviour But, calculations of misorientation axes from 2 individual measurements with misorientation of <15° contain increasingly large errors Angular resolution depends typically on basic EBSD set-up configuration, EBSD pattern quality & hence indexing software (parameters, composition, pseudo-symmetry, etc.) Examples (next slides)
Detector Detector Angular resolution 1:sample-detector considerations Small detector distance Large detector distance poor for indexing but good angular resolution good for indexing but poor angular resolution important for constraining misorientation axes.
large angular spread: low angular resolution low angular spread: good angular resolution Angular resolution 2:effect of angle imaged Changes in high resolution EBSD patterns can be used to define better rotation angles & more accurate misorientations
polycrystalline sample Control of crystal orientation on emission signal note variation in image grey-scale level - depends on penetration & emission, which depend on crystal orientation
quartzite EBSD microstructural images • Forescattered electrons (FSE) with intensities determined by penetration (i.e. crystal orientation) are emitted towards the EBSD detector • Electron beam is scanned over an area of a tilted sample, rather than positioning the beam on a point for EBSD patterns • FSE signal detected by silicon devices attached to EBSD detector • FSE Orientation Contrast image of variation in crystal orientation - contrast variations only qualitative (next slide)
beam beam Warnings 2 grains with the same orientation can have different OC signals 2 grains with different orientations can have the same OC signal due to different ‘incident angles’ due to effectively the same ‘incident angles’
(after D. J. Prior) OC images not quantitative ! • Grey-levels cannot be inverted to give orientation • Grains in the same orientation but different positions have different grey shades • Grains in different orientations could have the same grey shade • One image may show only 60% of boundaries – so, move the image slightly
Automated EBSD analysis • Computer controlled movement of the electron beam across a sample • EBSD pattern ‘captured’ at each point • Indexing of EBSD patterns is via pattern recognition software • Software writes the crystal orientation (3 Euler angles), & phase information per pattern to a data-base for later analysis • BUT – important to run a manual visual check of solutions before the automated analysis!
crystal orientation variation pattern quality - ‘strain’ orientation contrast crystal orientation ‘pole’ figures provides a variety of information Automated EBSDanalyses P T many other parameters: e.g. ‘misorientation’ (becoming very important in microstructural analysis)
Specimen Preparation • Polished blocks, thin-sections, natural fractured or grown surfaces • Surface damage (mm-mm) created by mechanical polishing must be removed: • chemical-mechanical (‘syton’) polish • etching • electro-polishing • ion beam milling • Insulating samples may require very thin carbon coat, but uncoated samples may perform OK - next
Uncoated 3-5nm C coat K-feldspar. 20keV ~15nA (after D.J. Prior) Charging Problems • Reduce charging by coating but only at expense of image detail &/or resolution • Note: specimen damage can occur in absence of charging
uncoated ~4nm C ~8nm C 200mm (after D.J. Prior) Effect of coating on OC images
Interim Summary • Orientation contrast images: • variations in crystallographic orientation & sample microstructure • EBSD patterns: • full crystallographic orientation of any point in OC image • Spatial resolution: • ~100nm (FEG, metals) to ~1mm (W, rocks) • Angular resolution: • ~1 - 2° (misorientation >5 °) • Materials: • most metals & ceramics; many minerals - depends on composition • Automated analysis: • 100’s of EBSD patterns/second (record ~800/sec via stage scanning) but indexing accuracy may suffer (use of fast or sensitive EBSD detectors increasing depending on requirements)
What can EBSD be used for? • Measuring absolute (mis)orientation of known materials - most popular/obvious usage • Phase identification of known polymorphs - becoming popular • Calculating lattice parameters of unknown materials - difficult, only possible for relatively simple structures? • Measuring elastic strain • Estimating plastic strain on the scale of the electron beam activation volume • Estimate aggregate elastic stiffness matrix (Cij) from grain crystal texture – used to predict material properties (e.g. thermal, electric, acoustic, magnetic, etc.)
Recommended applications • Tremendous significance for many types of materials research, including: - deformation & recrystallisation - understanding processing histories - effects of pre-heating & heat treatments - identifying phases in multi-component systems - microstructural characterisation & calibration (including boundary geometry, etc.) - modelling microstructural processes - constraining micro-chemical data - estimating physical properties (e.g. elastic, thermal, sonic, electric, magnetic) - etc.
Crystal orientation data from SEM/EBSD • Individual orientation measurements related to microstructure: crystal lattice preferred orientations/texture analysis (i.e. inverse/pole figures, orientation distribution functions misorientation data (similar types of plots) • Non destructive data be collected from representative samples • Automated statistically large/viable data sets acquired • BUT! Samples must be oriented: Materials - RD, ND, TD Rocks – X, Y, Z or NSEW
CPO/texture analysis • SEM/EBSD: faster than optical & gives full crystallographic information faster than X-ray goniometry & applicable to all crystals faster & simpler than neutron diffraction & applicable to all crystals does not suffer from problems associated with ODF calculations • BUT! only surficial analysis: restricted to electron beam penetration depths not 3D (unless incorporate serial &/or three orthogonal sections)
colour-coded pole figures colour-coded automated pseudo-image colour-coded inverse pole figures misorientation angle profile Dauphine twins subgrains Example: quartz
100mm 100mm 100mm Crystal orientation (Euler) image Phase 1: quartz Phase 2: feldspar Phase 3: mica Automated phase identification
In Situ Experiments “Crystal-probe” HT (1200C) FEGSEM (D.J. Prior, University of Liverpool) Note: column tilted to 70° - allows horizontal sample movement & greater access to sample chamber (i.e. various other electron-specimen signal detectors)
projected 2010 (~3500) April 2010
Selected bibliography • As of April 2010, searching for EBSD in Web of Knowledge results in ~3000 hits! So, here are some ‘early’ papers. • Lloyd, G.E. 1987. Atomic number and crystallographic contrast images with the SEM: a review of backscattered electron techniques. Mineralogical Magazine 51, 3-19. • Schmidt, N.-H. & Olesen, N.O. 1989. Computer-aided determination of crystal lattice orientation from electron channelling patterns in the SEM. Canadian Mineralogist27, 15-22. • Randle, V. 1992.Microtexture Determination and its Application. The Institute of Materials, London 174pp. • Randle, V. 1993. The Measurement of Grain Boundary Geometry. Institute of Physics Publishing, Bristol, 169pp. • Field, D.P. 1997. Recent advances in the application of orientation imaging. Ultramicroscopy67, 1-9. • Wilkinson, A.J. & Hirsch, P.B. 1997. Electron diffraction based techniques in scanning electron microscopy of bulk materials. Micron28, 279-308. • Humphreys, F.J. 1999. Quantitative metallography by electron backscattered diffraction. Journal of Microscopy195, 170-185. • Prior, D.J. 1999. Problems in determining the orientation of crystal misorientation axes for small angular misorientations, using electron backscatter diffraction in the SEM. Journal of Microscopy195, 217-225. • Prior, D.J. et al. 1999. The application of electron backscatter diffraction and orientation contrast imaging in the SEM to textural problems in rocks. American Mineralogist84, 1741-1759. • Trimby, P.W. and Prior, D.J. 1999. Microstructural imaging techniques: a comparison between light and scanning electron microscopy. Tectonophysics303, 71-81. • Wilkinson, A.J. 1999. Measurement of small misorientations using electron back scatter diffraction. Electron Microscopy and Analysis, Institute of Physics Conference Series, 161, 115-118.
Crystallographic data sources • Pearson’s Handbook, Desk Edition, Crystallographic data for intermetallic Phases, ASM international, 1997. ISBN 0-87170-603-2. • American Mineralogist - http://www.geo.arizon.edu/xtal-cgi/test • International Tables for Crystallography Volume A: Space Group Symmetry. Edited by T. Hahn, revised edition, 1996. ISBN 0-7923-2950-3; see also: http://ylp.icpet.nrc.ca/SGHT/1983/ http://www.cryst.ehu.es/cryst/ • Altwyk site: http://ylp.icpet.nrc.ca/altwyk/
Laboratory demonstration • Aims to show: basic SEM/EBSD set-up orientation contrast imaging EBSD pattern capture & indexing (including crystal & diffraction database construction) automation questions & answers (?) plus general advice