Download
1 / 8
110 likes | 154 Views
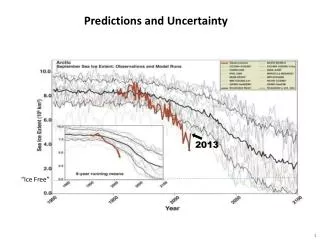
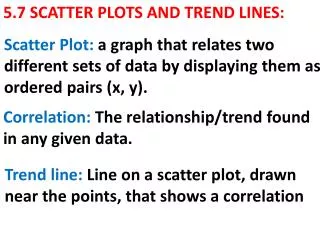
Learn how to make predictions using trend lines from scatter plots. Understand the relationship between data points and trends. Analyze associations and calculate slopes for accurate predictions.

E N D
Trend Lines and Predictions How can you use a trend line to make a prediction from a scatter plot? 14.2
ADDITIONAL EXAMPLE 1 The scatter plot and trend line show the relationship between the number of customers that enter an electronics store in a day and the number of TVs sold. Write an equation for the trend line. Answers may vary; sample answer: y = 0.05x
14.2 LESSON QUIZ Marni recorded the cost of different weights of apples and made a scatter plot of her data. For Exercises 1–5, use the sample trend line drawn in the scatter plot. 8.5.D, 8.5.I, 8.11.A 1. What type(s) of association does the scatter plot show? positive, linear 2. Find the slope of the trend line. 2
Marni recorded the cost of different weights of apples and made a scatter plot of her data. For Exercises 1–5, use the sample trend line drawn in the scatter plot. 3. Find the equation of the trend line. y = 2x 4. What is the meaning of the slope in this situation? The average cost of the price of apples is $2 per pound.
Marni recorded the cost of different weights of apples and made a scatter plot of her data. For Exercises 1–5, use the sample trend line drawn in the scatter plot. 5. a. Use the equation of the trend line to predict the cost of buying 5 pounds of apples. $10 b. Is this prediction an example of interpolation or extrapolation? interpolation
Use a graphing calculator to find the equation of a trend line for a scatter plot of the data. Then use the trend line to predict the distance traveled in 12 hours.
Follow the instructions given in the Extend Activity for Lesson 14.1 to make a scatter plot of the data. Press , select the “CALC” menu, then select “4: LinReg (ax+b)” and press . Press and then press and choose “5: Statistics”. Select the EQ menu and choose “1: RegEQ”. Press and choose ”9: ZoomStat” to see the trend line. 701 mi
How can you use a trend line to make a prediction from a scatter plot? Sample answer: Draw a trend line that fits the points as closely as possible. Then write an equation for that line, and use it to make predictions by substituting and solving.