Download
1 / 7
100 likes | 208 Views
Learn how to distinguish between linear and nonlinear sets of bivariate data through examples and explanations. Understand the characteristics of linear relationships and how to identify them graphically and algebraically.

E N D
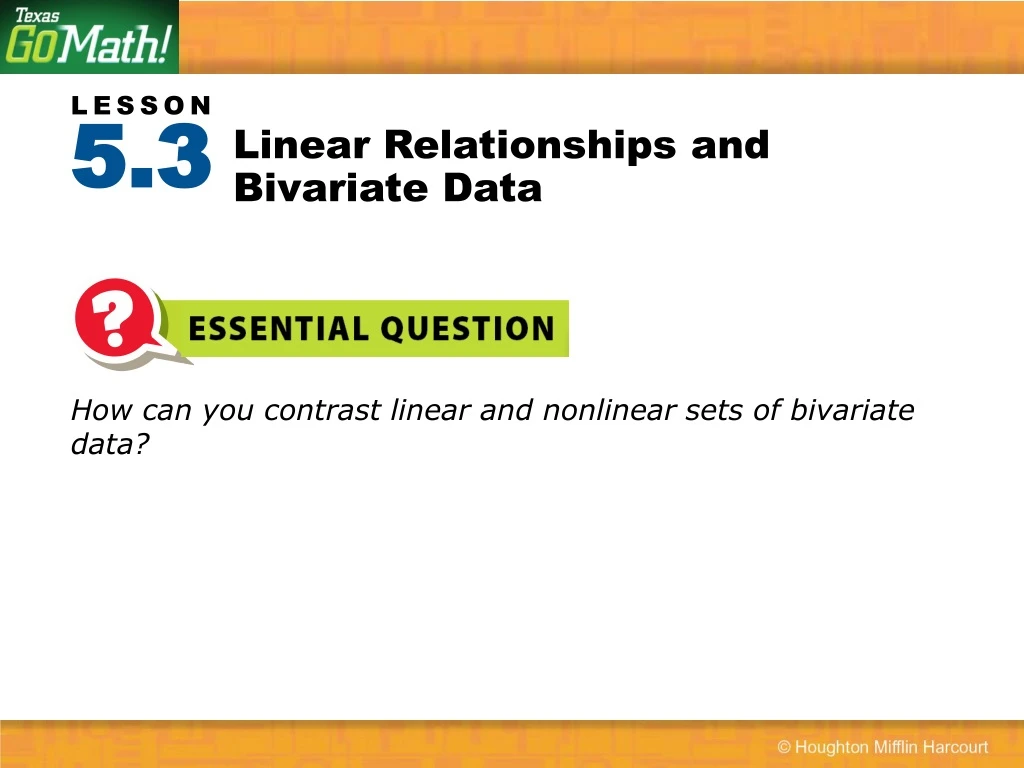
Linear Relationships and Bivariate Data How can you contrast linear and nonlinear sets of bivariate data? 5.3
ADDITIONAL EXAMPLE 1 The charge for a cheese pizza changes as the number of toppings changes. Show that the relationship is linear, and then find the equation for the relationship. A line passes through all the graphed points so the relationship is linear. y = 1.5x + 8
ADDITIONAL EXAMPLE 2 The graph shows the distance of a train from a landmark as it travels at a constant speed. Use the graph to predict what the distance will be after 7.5 hours. 400 miles
5.3 LESSON QUIZ 8.5.C, 8.5.D, 8.5.I 1. Does this table represent a linear relationship? Why or why not? No, the slope is not the same between 2 and 3 and between 3 and 4. 2. Change one value in this table so that this table does represent a linear relationship. Change y to 11 for x = 3.
Explain whether or not each relationship is linear. 3. The number of inches in a student’s height and the height in feet Yes, the rate of change is a constant 12 inches per foot. 4. The radius of a circle and its area No; the rate of change is not constant.
Explain whether or not each relationship is linear. 5. An amusement park charges a price for admission and a price for each ride. Joe spent $10.50 and went on 4 rides. Janie spent $14.25 and went on 9 rides. Write a linear equation for the amount spent and predict the amount you would spend to go on 17 rides. a = 0.75r + 7.5; $20.25
How can you contrast linear and nonlinear sets of bivariate data? The graph of a linear set of data is a single line; the graph of a nonlinear set of data is not a single line.