Download
1 / 26
260 likes | 408 Views
Sections 5.1 & 5.2 Inequalities in Two Variables. After today’s lesson, you will be able to graph linear inequalities in two variables. solve systems of linear inequalities. solve applications of linear inequalities in two variables. Strategy For Graphing Linear Inequalities.

E N D
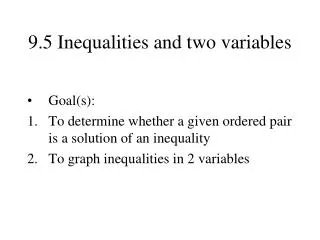
Sections 5.1 & 5.2 Inequalities in Two Variables After today’s lesson, you will be able to • graph linear inequalities in two variables. • solve systems of linear inequalities. • solve applications of linear inequalities in two variables.
Strategy For Graphing Linear Inequalities • Express the inequality in slope-intercept form (if it is not a vertical line.) • Graph the related equation as the boundary line. • If the symbol is < or > , draw the line dotted. • If the symbol is or , draw the line solid.
Strategy For Graphing Linear Inequalities • Choose a test point on either side of the boundary line. The point (0, 0) is a good choice, if it is not on the boundary line. Substitute the values of x and y into the original inequality. • If the statement is TRUE, shade the half-plane containing the test point. • If the statement is FALSE, shade the half-plane NOT containing the test point (the opposite side).
Strategy For Graphing Linear Inequalities • Notice, for equations in slope-intercept form: • If y< or y, shade below the line. • If y> or y, shade above the line. • Label the equation of the boundary line (use an = sign) and label the test point.
Graphing a Linear InequalityExample 1 Example 1: Graph the linear inequality y x
Example 1Calculator Graph This is what the graph of the inequality looks like on a graphing calculator. Notice that we won’t be able to graph the dotted boundary line.
Example 2 Example 2: Graph the inequality 3x – 5y≥ 15. y x
Example 3 Example 3: Graph the inequality 2x > 8 y x
Example 4 Example 4: Graph the inequality y x
Solving Systems of Inequalities • We now consider systems of linear inequalities such as • To solve such systems graphically means to graph all ordered pairs (x, y) that simultaneously satisfy all the inequalities in the system. • The graph is called the solution region for the system (or feasible region.)
Solving Systems of Inequalities • To find the solution region, we graph each inequality in the system and then take the intersection (overlap) of all the graphs. • To find the intersection, lightly shade the solution region for each inequality separately. • Darken in the region where the all of the regions overlap. Erase any shading that is not in the overlapping region. • Make sure it is very clear which region is the solution of the system (your final answer).
Example 5 Example 5: Solve the system y x
Corner point Corner Points A corner point (or vertex) of a solution region is a point in the solution region that is the intersection of two boundary lines. In the previous example, the solution region had a corner point of (4,0) because that was the intersection of the lines y = -1/2 x + 2 and y = x – 4.
Bounded vs. Unbounded • A solution region of a system of linear inequalities is BOUNDED if it can be enclosed within a circle.
Bounded vs. Unbounded • If it cannot be enclosed within a circle, it is UNBOUNDED.
Example 6 Example 6: Solve the system: y x Is the solution bounded or unbounded?
Example 6(on the calculator) Now, Solve the system using the calculator: x
Example 7 Example 7: Solve the system
y x Example 7 (continued) Is the solution bounded or unbounded?
Example 8 Example 8: Solve the system and give the coordinates of any corner points (vertices) formed.
y x Example 8 (continued) Is the solution bounded or unbounded?
Application Labor costs for a farmer are $55 per acre for corn and $45 per acre for soybeans. The farmer wants to spend no more than $6,900 on labor. Let x represent the number of acres of corn and y represent the number of acres of soybeans. Write a system of inequalities to represent the appropriate constraints on x and y. Graphically find the set of feasible solutions (i.e. graph the feasible region.)