Download

1 / 9
100 likes | 302 Views
Graphing Linear Inequalities. Linear Inequalities. A linear inequality in two variables can be written in any one of these forms: Ax + By < C Ax + By > C Ax + By ≤ C Ax + By ≥ C

E N D
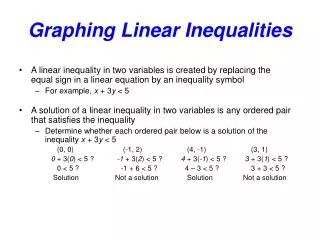
Linear Inequalities • A linear inequality in two variables can be written in any one of these forms: • Ax + By < C • Ax + By > C • Ax + By ≤ C • Ax + By ≥ C • An ordered pair (x, y) is a solution of the linear inequality if the inequality is TRUE when x and y are substituted into the inequality.
Example 1 • Which ordered pair is a solution of 5x - 2y ≤ 6? • (0, -3) • (5, 5) • (1, -2) • (3, 3)
Graphing Linear Inequalities • The graph of a linear inequality is the set of all points in a coordinate plane that represent solutions of the inequality. • We represent the boundary line of the inequality by drawing the function represented in the inequality.
Graphing Linear Inequalities • The boundary line will be a: • Solid line when ≤ and ≥ are used. • Dashed line when < and > are used. • Our graph will be shaded on one side of the boundary line to show where the solutions of the inequality are located.
Graphing Linear Inequalities Here are some steps to help graph linear inequalities: • Graph the boundary line for the inequality. Remember: • ≤ and ≥ will use a solid curve. • < and > will use a dashed curve. • Test a point NOT on the boundary line to determine which side of the line includes the solutions. (The origin is always an easy point to test, but make sure your line does not pass through the origin) • If your test point is a solution (makes a TRUE statement), shade THAT side of the boundary line. • If your test points is NOT a solution (makes a FALSE statement), shade the opposite side of the boundary line.
y 5 x -5 -5 5 Example 2 • Graph the inequality x ≤ 4 in a coordinate plane. • HINT: Remember VUX HOY. • Decide whether to use a solid or dashed line. • Use (0, 0) as a test point. • Shade where the solutions will be.
y 5 x -5 -5 5 Example 3 • Graph 3x - 4y > 12 in a coordinate plane. • Sketch the boundary line of the graph. • Find the x- and y-intercepts and plot them. • Solid or dashed line? • Use (0, 0) as a test point. • Shade where the solutions are.
y 5 x -5 -5 5 Example 4: Using a new Test Point • Graph y < 2/5x in a coordinate plane. • Sketch the boundary line of the graph. • Find the x- and y-intercept and plot them. • Both are the origin! • Use the line’s slope to graph another point. • Solid or dashed line? • Use a test point OTHER than the origin. • Shade where the solutions are.