Download
1 / 17
170 likes | 256 Views
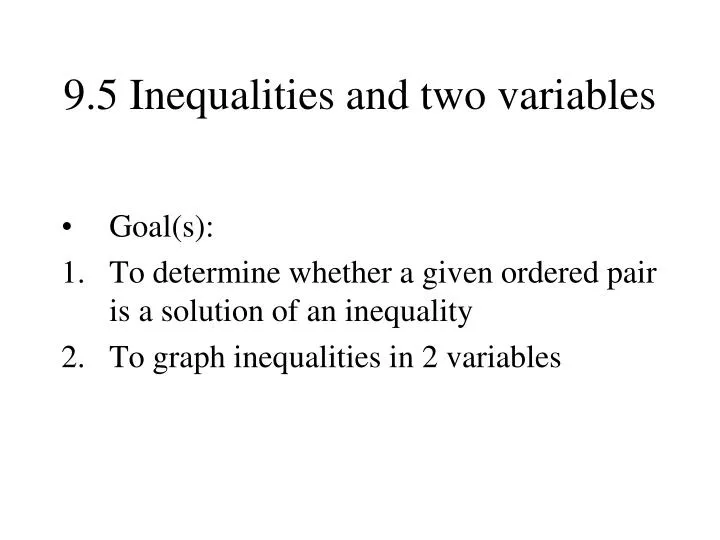
9.5 Inequalities and two variables. Goal(s): To determine whether a given ordered pair is a solution of an inequality To graph inequalities in 2 variables. Is ( 2,3 ) a solution of 5x + 2y < 23 ?. 5( 2 ) + 2( 3 ) < 23. YES!. Is ( 2,1 ) a solution of x + y < 4 ?.

E N D
9.5 Inequalities and two variables • Goal(s): • To determine whether a given ordered pair is a solution of an inequality • To graph inequalities in 2 variables
Is (2,3) a solution of 5x + 2y < 23 ? 5(2) + 2(3) < 23 YES!
Is (2,1) a solution of x + y < 4 ? (2) + (1) < 4 YES!
Is (4,8) a solution of y > 2x + 1 ? (8) > 2(4) + 1 no
Is (-3,5) a solution of y > 2x + 1 ? (5) > 2(-3) + 1 yes Is (-3,6) a solution of y > 2x + 1 ? Is (-3,19) a solution of y > 2x + 1 ? Is (-3,458) a solution of y > 2x + 1 ?
To Graph an Inequality • Use either the table method, x and y intercepts method, or slope intercept method to graph (graph as if it was an =) • If it is a < or> the line will be a broken line and if it is a ≤ or ≥ the line will be solid • Pick an ordered pair that is not on the line • Plug the order pair into the inequality - if it makes the inequality true shade in everything on that same side of the line -if it makes the inequality false shade in everything on the opposite side of the line of the point
boundary line Graph: 2x + 3y 12 Is (1,1) a solution? Is (-4,2) a solution? x Is (5,2) a solution? Is (5,-2) a solution? Is (1,4) a solution? Is (0,0) a solution? x Is (3,3) a solution? Is (3,2) a solution? x half-planes
To graph: 2x – 5y < 10 • Graph the boundary line 2x – 5y = 10. Use a dotted line for “< “ and a solid line for “”. • Determine which half-plane is the solution by testing one point not on the boundary line. (0,0)
Graph: y– 2x 0 • Graph the boundary line y – 2x = 10. Use a dotted line for “< “ and a solid line for “”. • Determine which half-plane is the solution by testing one point not on the boundary line. (0,0) y = 2x + 0
To Identify the Inequality • Identify the y-intercept (that is your b) • Count out the slope (rise over run from left to right) • Look for solid or dashed line • Plug in an ordered pair from the shaded area into your choices and see which inequality is true
This graph represents which inequality? • Check (0,0) • Check “b” • Check slope + or neg
This graph represents which inequality? • Check (0,0) • Check x and y intercepts • Check dotted line
X>3y Y< x-5 X+ Y ≥3 5X + 4Y ≤20 Graph on white boards