Download
1 / 30
300 likes | 303 Views
New England SPARROW Water-Quality Nutrient Models. Richard Moore, Craig Johnston, and Keith Robinson USGS, NH/VT District, Pembroke, NH. Today’s Presentation What is SPARROW SPARROW model results for New England Introduce potential uses of SPARROW data.

E N D
New England SPARROW Water-Quality Nutrient Models Richard Moore, Craig Johnston, and Keith RobinsonUSGS, NH/VT District, Pembroke, NH
Today’s Presentation • What is SPARROW • SPARROW model results for New England • Introduce potential uses of SPARROW data
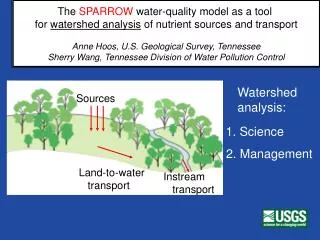
SPARROW (Spatially Referenced • Regressions On Watershed Attributes) • Described in Smith and others, Water Resources Research, 33(12): 2781-2798 • An empirical approach relating observed water- quality data (TN and TP loads) to upstream watershed characteristics in a GIS framework
SPARROW (Spatially Referenced • Regressions On Watershed Attributes) • Incorporates variables to simulate in-stream processes • Incorporates only statistically significant variables.
Hydrologic Network – the Back-bone of SPARROW Upstream monitoring station Point source Reach segment Reach segment contributing area Downstream monitoring station
Purpose of the New England Model is to support major water-quality management activities • · Nutrient criteria development - Ranges in nutrient levels in rivers and streams throughout the region • · TMDL program - Identification of factors (sources and watershed characteristics) affecting nutrient levels • · Coastal Water Assessments - Transport of nutrients by rivers (especially interstate) to coastal waters
Design of the New England SPARROW Model • Focus on Total Nitrogen and Total Phosphorus loads • Model for the mid-1990s time period • Improve on national model for more spatial detail and using local data sets • Collaboration with EPA and NEIWPCC
Status of the New England SPARROW Modeling Effort • Final models calibrated and applied to region • Final report is published • EPA/NEIWPCC conducting external review
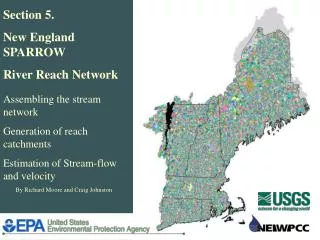
New England Model • Watersheds and Streams • Reaches • Based on the National • Hydrography • Data Set (NHD) • Approx 42,000 in model • Average 1.7 mi2 in size • Corrected to NRCS 12-digit watersheds • Hydrologically connected
Generation of NHD Reach CatchmentsUsing a Hydrologically-Conditioned DEM Incorporating: National Hydrography Dataset (NHD) Watershed Boundary Dataset (WBD) National Elevation Dataset (NED) NE SPARROW developed a process to create a DEM which recognizes these three datasets
Nutrient Water-Quality Monitoring Sites used in SPARROW Model
Nutrient (Dependent) Data to be Used in the Model • Collected data from USGS, STORET, States, research studies during the 1980-2000 time period. • Calculated discharge/nutrient relation to predict nutrient loads during all conditions of a hydrograph using the USGS Estimator Program. 67 TP and 65 TN sites • Mean annual loads for years of water-quality and streamflow data
Atmospheric Deposition of Nitrogen Range 3.2 to 12.0 kg/ha/yr (Ollinger and others, 1992) NE SPARROW Model Input Nutrient Sources Point Source Atmospheric deposition of nitrogen ( Ollinger 1992) National Land Cover Dataset 1992 - Agriculture - Developed - Forest Processes Land to water delivery Soil permeability – STATSGO In-stream loss Mean annual stream-flow Reservoir detention
Model Calibration Results for the • New England SPARROW Nitrogen Model • R-squared = .95, MSE = 0.16 • Variable Bootstrap Standard • model error of p-value • SOURCES coefficient coefficient • Municipal wastewater- • treatment facilities 1.13 0.36 <.005 • Atmospheric deposition .36 .07 <.005 • Cultivated agricultural • land (kg/km2/y) 910 362 .005 • Developed urban • land (kg/km2/y)988 385 .010
Model Calibration Results for the • New England SPARROW Nitrogen Model (cont.) • R-squared = .95, MSE = 0.16 • Variable Bootstrap Standard • model error of p-value • coefficient coefficient • Delivery variable: • Natural Log of • Soil Permeability 0.36 0.14 <.005 • Decay Variable: • Stream decay .71 .52 .065 • for streams <= 100 cfs • (per day)
Model Calibration Results for the • New England SPARROW Phosphorus Model • R-squared = .94, MSE = 0.23 • Variable Bootstrap Standard • model error of p-value • SOURCES coefficient coefficient • Municipal wastewater- • treatment facilities 1.28 0.22 <.005 • and pulp and paper • Forested Land 12.7 4.1 <.005 • (kg/km2/y) • Cultivated agricultural • land (kg/km2/y) 110 27.5 <.005 • Developed urban • land (kg/km2/y)37.8 14.3 .005
Model Calibration Results for the • New England SPARROW Phosphorus Model (cont.) • R-squared = .94, MSE = 0.23 • Variable Bootstrap Standard • model error of p-value • coefficient coefficient • Decay variables: • Reservoir decay for small • lakes and reservoirs 105 59.7 .04 • (<= 10 km2)(m/y) • Decay Variable: • Stream decay .42 .41 .125 • for streams <= 100 cfs • (per day)
SPARROW Model Results: Predicted Total Nitrogen Catchment Yield Contributions to Total Nitrogen from each source + = Atmospheric Urban + + Agriculture Point Source
Atmospheric Deposition of Nitrogen Low High Atmospheric Deposition of Nitrogen
SPARROW Model Results: Atmospheric Deposition
SPARROW Model Results: Developed Land
SPARROW Model Results: Agricultural Land
SPARROW Model Results: Identifying Primary Sources of Nutrients Primary Sources of Nitrogen Primary Sources of Phosphorus Atmospheric Forest Agricultural Urban Urban Agricultural Point Source Point Source
Utility of New England SPARROW Model Results for Nitrogen Loading Assessments An Example from the Connecticut River Basin
Estimated Mean Annual concentration of (A) Nitrogen and (B) phosphorus.
Model Strengths (cont.) • SPARROW has been recognized by the National Academy of Sciences and National Research Council as a suggested regional assessment tool, specifically for TMDLs