Download
1 / 42
420 likes | 514 Views
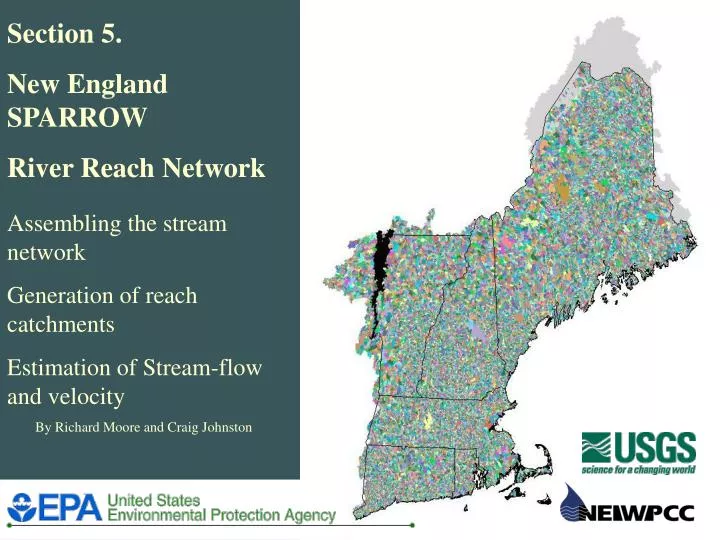
Section 5. New England SPARROW River Reach Network. Assembling the stream network Generation of reach catchments Estimation of Stream-flow and velocity By Richard Moore and Craig Johnston. Selecting a Stream Network. Choices Available: RF1 – 1:500,000 scale

E N D
Section 5. New England SPARROW River Reach Network Assembling the stream network Generation of reach catchments Estimation of Stream-flow and velocity By Richard Moore and Craig Johnston
Selecting a Stream Network • Choices Available: • RF1 – 1:500,000 scale • Used in the National and Chesapeake SPARROW models • Reaches have estimation of stream-flow and velocity • SPARROW programs compatible with RF1 network • NHD – 1:100,000 scale • Never used for SPARROW modeling • NHD reaches do not have stream-flow and velocity estimates
Why NHD was selected for New England • RF1 stream density was inadequate for certain areas in NE Density problems in RF1 related to source scale maps RF1 Stream Network
Why NHD was selected for New England (cont) RF1 Stream NHD Stream • Greater spatial detail • Better accuracy in model calibrations • More detail in model predictions • All load sites are on the network
What is NHD? • A digital map representation of hydrographic features • Consist of linear stream routes and 2-dimensional surface water bodies • Network and 2-d features linked with relational databases • Permanent, Public Ids - Reach Codes • Nationally Available Dataset (1:100K) • Multi-Scale – 1:100K, 24K, and better
NHD Stream Network Properties • Consist of 2 ARC/INFO route systems built upon the underlying arc topology • Route.rch – Can consist of multiple arcs for one route feature. Attributes: • reach code, stream name, stream level, com_id - • Route.drain – Consist of one arc segment for each drain route feature. Attributes: • fcode, ftype, com_id, rch_com_id, wb_com_id
Pond less than 10 acres in area 3 drain route segments - 3 drain com_ids have the same rch_com_id as ------------------------ com_id in route.rch Drain Rch Stream/River Artificial Path Route.rch
NHD Reach Flow Relationships The NHD flow table shows what reach flows into another S S FlowTable 1 2 com1 com2 Direction 1 3 In 2 3 In 0 1 Network Start 0 2 Network Start 3 0 Network End 3 E
NHD Availability Free download at nhd.usgs.gov Distributed at 8-digit cataloging unit level 100K 24K
Initial Experiences from using the NHD • Certain corrections and enhancements were needed • NHD data model and relational tables were complex to understand at first • NHD tools in ArcView 3.x were extremely helpful for navigation tracing and understanding the complex relations between NHD features and associated tables
Corrections/Enhancements needed because: • Source maps for DLG data are general purpose maps • Shows only surface-flow; subsurface flow from man made features such as culverts not mapped • 100:000-scale topo maps produced from multiple source scales • - In New England, 24K, 25K metric series, 1:62,500 maps used • - Multiple stream density differences occurred • Generalizations of larger-scale data to produce 100K maps introduced other errors
a r n D a i g e D i v i d e Figure 1a. Errors show stream crossing drainage divide, connecting to a tributary draining upstream. Flow tables in NHD show wrong flow direction Figure 1b. Corrections made to NHD – Changes to stream vectors lines and flow relationships
4 2 # 0 1 1 1 0 0 0 0 - S t . F r a n c o i s 3 m o n t V e r 1 Corrections
Added 273 Canadian reaches for Lake Champlain, Connecticut River, and St. Francois River basins • Canadian data from Natural Resources Canada National Topographic Database (NTDB), 1:50,000-scale • Canadian data not obtained for Upper St. John and St. Croix River basins
RF1 2,462 Reaches NE SPARROW Enhanced NHD 42,000 Reaches
NHD Network Building Notes • No tools for adding, splitting reaches available at this time. Requires manual editing in Arc/Info workstation • NHDEdit Tools in ArcView can be used to edit flow relationship tables • New NHD value added attributes for drain.route system and new drain flow table could be utilized for future SPARROW models • Training in Advanced Arc/Info and NHD recommended
New England SPARROWGeneration of Reach Catchments • Catchments are delineated from a modified DEM produced by integrating NED, NHD, and the National Watershed Boundary Dataset (preliminary – NRCS) • Process involves using U. of Texas AML program called Agree to “burn” NHD stream network into the NED data. Forces our analysis of the DEM to recognize hydrography of the NHD as the lowest point • NRCS 1:24,000-scale WB data is added to the output DEM from Agree as a “wall” to force our analysis of the DEM to recognize manually interpreted watershed divides
12-digit Cataloging Unit- Kezar Lake, ME Spatial Detail of Reach Catchments 8-digit Cataloging Unit – Saco River, NH-ME
Estimation of Stream-Flow • Randall (1996) Runoff contour map used to calculate runoff delivered by each catchment • NHD navigation tool and custom Avenue Script used to accumulate upstream catchments for a selected reach, and sum all upstream catchment cfs and drainage areas to derive a mean annual flow, and total drainage area
53% 30% 10% 7% Comparison of Estimates of Stream-Flow with Observed Gaging Station Data Percent Difference
Estimation of Settling Factor for Lakes and Reservoirs • Water body polygons are in the NHD • Settling factor for lakes and reservoirs = surface area / flow
Estimation of Velocity (for time of travel for stream reaches) • Velocity estimated from Jobson (1996) equation; function of drainage area size, streamflow and slope • Stream reach slope and channel elevations calculated using special technique with NED, NHD, NHD flow-table, and NHD catchments.
Elevation at DEM pour point 320 meters Basin min elevation = 340 meters Basin min elevation = 320 meters 320 meters assigned minimum elevation for NHD reach# 1’s stream pour point DEM Stream Maximum elevation for NHD reach # 1 assigned upstream incoming reach’s minimum elevation (342 meters) Basin min elevation = 342 meters NHD Stream Assigning Minimum and Maximum Stream Channel Elevations for NHD to Reaches NHD Reach-id 1
National SPARROW (RF1) New England SPARROW (NHD & NED) NH Travel Time Study (preliminary graphical estimates by Thor Smith) Reach Velocities (meters / second) East Branch of the Pemigewasset River 1.28 1.80 1.9 Lower Contoocook River 1.45 1.05 1.1 1.78 1.37 0.95 Merrimack between Manchester and Nashua 2.39 1.96 1.4 2.45 1.44 1.5
An example of using stream channel elevations to identify reaches with tidal influence. Based on National Oceanic and Atmospheric Administration (NOAA) / National Ocean Service CO-OPS water level data.
Conclusions With some additional elbow grease the NHD makes a great foundation for SPARROW modeling. And other applications, such as: Stream-gage Network Analysis Water-quality Network Design Mercury Model Ground-Water Recharge Model
Potential Application Groundwater Recharge Model