Download
1 / 37
370 likes | 461 Views
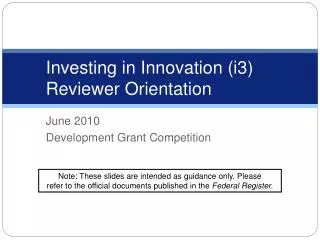
Investing in the Best and Brightest: increased fellowship support for American scientists and engineers. 1) Great concern -- why? 2) The Pseudo-experiment and Data 3) Results for grad fellowships 4) Extension to all grad enrollments

E N D
Investing in the Best and Brightest: increased fellowship support for American scientists and engineers 1) Great concern -- why? 2) The Pseudo-experiment and Data 3) Results for grad fellowships 4) Extension to all grad enrollments 5) The problem in economics of occupational choice – expectations Minority game Richard Freeman, NBER and Harvard Centre for Economic Performance, LSE ESSID TALK Dubrovnik, Sept 4, 2007
1) The Issue: US concern over Science-Engineering Enrollments of Citizens/Residents • We must “enhance the science-technology enterprise so the US can compete, prosper, and be secure” National Academy of Sciences Rising Above The Gathering Storm: Energizing and Employing America for a Brighter Economic Future, 2006 • At least 20 reports saying much the same: Association of American Universities (2005), the Government, University, Industry Roundtable (2003) • Bill Gates, Craig Barrett ….
The Department of Defense and the defense industry are “having difficulty attracting and retaining the best and brightest students to the science and engineering disciplines relevant to maintaining current and future strategic strike capabilities.” U.S. Department of Defense 2006 (but they are getting good bugs; Toronto Star, April 1, 2006) Uncle Sam's Scientists Busy Building Insect Army: Defence research agency creates landmine-sniffing bugs) • “To maintain our leadership amidst intensifying global economic competition, we must make the best use of talented and innovative individuals, including scientists, engineers, linguists, and cultural experts. The nation must cultivate young talent and orient national economic, political, and educational systems to offer the greatest opportunities to the most gifted American and international students.” American Association of Universities 2006 • “If trends in U.S. research and education continue, our nation will squander its economic leadership, and the result will be a lower standard of living for the American people.” National Summit on Competitiveness 2005
The President is Convinced 2006 State of the Union Address, President Bush announces the American Competitiveness Initiative. “For the U.S. to maintain its global economic leadership, we must ensure a continuous supply of highly trained mathematicians, scientists, engineers, technicians, and scientific support staff.” Spending for Iraq: $$$$$$$$$$$ … Tax cuts for wealthy $$$$$$$ Support for SE: $ Evolution? Stem Cell? NEVER Scientists speaking their mind? Get a minder Climate change? Hmm.
But maybe you want more to be convinced.There is no labor market shortage: Employment rises; wages have not increased much. PhD S&E workers grows from 500,000 in 1990 to 663,600 in 2003 Big increase is in foreign-born Foreign-born Share of Scientist and Engineers Employment 1990 2000 Bachelors 11% 17% Masters 19% 29% All PhD 24% 38% PhDs< 45 27% 52% Post-Doc 51% 60%
So why concern? Loss of relative position • The Falling US share of science and engineering resources and R&D • Share of World Population 5% • Share of college students • 1970 30% • 2000 14% • Share of S&E PhDs • 1975 40% • 2010 15% • US share of World R&D • 1970 ~50% • 2003 33-35% But this HAS to happen; can maintain excellence but not quantitative dominance
Why the concern? Cynical View Sci-Tech Establishment wants more low wage labor : early 1980s, NSF proclaimed a scientists and engineers’ shortage that turned out to be based on policy-makers’ erroneous use of data, possibly motivated by a desire to reduce the cost of scientists and engineers to large firms (Weinstein). In 1990 Richard C. Atkinson, then president of the American Association for the Advancement of Science (AAAS) predicted that by the year 2000, demand for scientists in the U.S. would outstrip supply by almost 400,000. He recommended programs to encourage more young people to pursue doctorates in science and engineering. But four years later, there was no evidence of a shortage. Newsweek ran an article on the science work force under the headline. NO PH.D.S NEED APPLY: The government said we wouldn't have enough scientists. Wrong (1994 Newsweek Dec 5).
More Benign Interpretation • Country lacks demand for S&E workers that would keep GDP growing at max possible given the US is at tech frontier • This is more important than before bcs of global competition of low wage countries”Human resource leapfrogging” -- populous low income countries (China, India) competes in high tech, which has adverse effects on gains from trade/incomes in advanced country; can lose income, good jobs etc --necessary to maintain comparative advantage. • National security • Supply is “imbalanced” with too few US citizens in science and engineering. Too risky to rely increasingly on immigrant and foreign-born supplies
2) The Pseudo-experiment: Changes in value and number of NSF GRFs What is Graduate Research Fellowship Program ? The NSF’s main fellowship program “to ensure the vitality of the scientific and technological workforce in the United States and to reinforce its diversity … supports outstanding graduate students in the relevant science, technology, engineering, and mathematics disciplines who are pursuing research-based master’s and doctoral degrees. NSF Fellows are expected to become knowledge experts who can contribute significantly to research, teaching, and innovations in science and engineering. These individuals will be crucial to maintaining and advancing the nation’s technological infrastructure and national security as well as contributing to the economic well being of society at large.” Applicants must be United States citizens or nationals, or permanent resident aliens of the United States. What is the Pseudo-experiment? Large variation in value of awards and numbers RELATIVE to population whose timing depends in large part on non-job market related events so … largely random. Huge increase in value between 1999 to 2005 goes from $15,000 to $30,000
30 3000 25 2500 Annual Stipend Amount 20 2000 # of People 15 Thousands of Constant Dollars (2003) 1500 10 Awardees 1000 5 500 0 0 1950 1960 1970 1980 1990 2000 NSF Graduate Research Fellowship Program (1952 - 2004) The number and value of GRF awards vary over time.
500 8 Bachelors 7 400 6 5 300 4 GRF Awardees per Thousand Bachelors Thousands of S&E Bachelors Awardees 200 3 2 100 1 0 0 1950 1960 1970 1980 1990 2000 GRF Awardees as Proportion of S&E Bachelors (1952 - 2004) The number of awards per S&E baccalaureate has shifted downwards
Changed Distribution of GFRP Awardees by Field:Decline of Physical Sciences bcs changed distribution of applicants
Primary Data Source: NSF’s Cumulative Index (CI), including Follow-Up Data
Empirical analysis of GRF: Questions and Research Strategy • What determines who gains award? How “thick” is the margin of applicants • When the number or value of awards changes, what happens to the number and quality of applicants, awardees, and graduates? – time series/cross field • N = SN(#awards, $awards, X) • Q = SQ(#awards, $awards, X) • Does change in # /value affect all grad enrollments? -- bit of stretch need “GE” effects
What determines who gets award: Linear Probability Model for the Impact of Scholastic and Demographic Variables Source: NSF, Division of Graduate Education, Cumulative Index of the GRF Program and related datasets.
800 750 700 GRE Quant GRE Verbal 650 600 550 1 2 3 4 5 6 7 8 9 10 Quality of GRFP Applicants on the Margin of Getting and Award, 2004 Source and Notes: All persons to the left of the line were given awards. All persons to the right of the line did not get awards. The numbers relate to groups of 50 persons, ordered by the estimated probability they would win an NSF award. The 5th group consists of 50 awardees with the lowest probability of getting an award, the 4th group consists of 50 awardees with the next lowest probablity, and so on. The 6th group consists of the 50 non-awardees with the highest probablity of getting an award. The probabilities are predicted values from an OLS regression of an award receipt dummy variable on panel rating, female dummy, underrepresented minority dummy, and eight field dummies.
Determinants of the Number of GRFP Applicants, 1969-2004 Source: NSF, Division of Graduate Education, Cumulative Index of the GRF Program and related datasets, as described in text. Outside salary are earnings of college graduates aged 21-25. Outside salaries and unemployment rates from Current Population Survey
What determines quality of Awardees: GRE Quantitative Scores of Awardees and relative Stipend Value, 1968-2004 Source: NSF DGE, Cumulative Index of the GRF Program and related datasets. Salary data estimated from the Integrated Public Use Microdata Series (IPUMS) of the March Current Population Survey.
Determinants of Awardee Achievement, 1969 - 2004 Source: Tabulated from NSF, Division of Graduate Education, Cumulative Index of the GRF Program and related datasets, as described in text. Outside salary are earnings of college graduates aged 21-25, tabulated from Current Population Survey.
4) Does it affect total supply? Depends on impact on other fellowships Universities and others followed suit, so going rate rose toward the $30k Objections from universities to the increase because of this Would like to have … what happened to people on margin? Impact of other increases. But all I have is:
Harvard Undergrad Survey “If you won a National Fellowship for graduate study of $40,000 a year, would you go on to graduate work in science and engineering?” Seventy-three percent of the science concentrators said that they would go on, and 40% of all students said they would go on to graduate student, which is far above the 18% who said that they were intending on careers in science and engineering.
Stipends As Policy Instrument Time in graduate school/postdoc represents up to ¼ of a scientist’s career. (6 years grad school + 4 years postdoc = 10 years out of 40 year career) Salary over first ¼ will have a non-trivial effect on lifetime earnings – larger than later $ because of discounting Signalling effect to student can also be important Quantity and price dimensions – policy can alter number of awards and value of awards
Objections/Problems Why not free ride on foreign born? 1. US is an excellent source of talented science and engineering students, about whose abilities our universities has greater knowledge about than the talents of students from overseas. 2. free ride will not go on ad finitum 3. trade-off between the supply immigrant labor and of native-born labor in science and engineering Is this special pleading for “our sector”? Not if modern economic growth depends on basic research; benefits flow to all through consumption side, but uncertain about production side.
4) Key issue : Expectations when what you expect depends on what you expect others expect Brian Arthur’s El Faro analysis: You want to go to the bar if less than 60% of the population go to the bar. Your decision depends on your expectations of how many other people will go ... but the decisions of the others depends on their expectations, so your decision depends on your expectation of their expectation. “a fierce assault on the conventions of standard economics.” • 1) there is no deductively rational solution to this problem, since do not know expectational model of other agents • 2) Expectations have divergent property: if all believe most will go, nobody will go, invalidating that belief. Even Zero intelligence agents could get close to equilibrium: assume each makes random prediction from uniform distribution 0 to 100. Then on average 60 people predict <60 and show up. The variance of attendance will be variance of binomial – in this case 100 (.6)(.4) = 24. Can some intelligence help reduce variance?
This is career choice problem: if everyone does economics of science, going to be crowded field It is also a problem in financial markets – you want to be in the MINORITYIt is one reason the hedge funds have gotten into problem – each follows the same strategy* Other famous Yogisms: It ain't over till it's over; If I didn't wake up I'd still be sleeping."; "I usually take a two hour nap, from one o'clock to four.""If you don't know where you're going, you'll wind up somewhere else." ; "The future ain't what it used to be.“Why buy good luggage? You only use it when you travel.“ “It’s déjà vu all over again.” American Philosopher Yogi Berra “It’s so crowded, no one goes there anymore”*
Say each player in minority gets 1 point, then socially optimal is for (N-1)/2 to be on minority side (N is odd number): 7 players, 3 winners. Output is 3 if 3 in minority (3 of 7) but less if 1or 2 are on minority. This is non-zero sum The minority game reflects ANY choice situation where numerous anonymous players interact through a single price Physicists study the minority game, using mean field theory of statistical mechanics, where the aggregate (not your near neighbors) determines outcomes and prediction of aggregate determines your decision: “The MG is a complex dynamical disordered system which can be understood with techniques from statistical physics. Analysis is largely theoretical with some AA simulations and experiments with people vs people or agents.
Assumptions 1 – Common knowledge of outcomes – all agents know which choice was minority 2 – Agents use history to make decisions 3 – Learn from own experience; not know anything about the others except for common knowledge 4. Heterogeneous strategies, since individuals have different ways to convert available information into expectations about future. A strategy is a rule that takes past history and leads to a decision, 0 or 1.
To model MG assume that when agents face complex scenarios they look for patterns that occurred in the past and predict next move from that experience. A strategy is a mapping from the last M periods to the action of the agent, – a look-up table which tells the agent what to do as a function of the M periods. • There are two parameters: number of players N, and periods, M. The other potential parameter is S, the number of strategies that players pick from the potentially large number possible. But studies take a fixed S and focus on N. Think of S as scaling • Each period, they compute how their S strategies would have done in the M last periods. and choose the highest payoff strategy for the next period. • There are 2M histories. Each history is a 0 or 1 that gives the winner in that period. A strategy means assigning a 0 or 1 decision to each history. Say M=3. Then there are 23 possible histories: 000, 001, 010, 011,100,101, 110, 111. • What you must decide is if there were 000 do I choose 0 or 1? And then what I do for all the other 8 outcomes.
Given history, one strategy would be 000–> 1 (go with the loser). 001 0, as below. Since for each of the 8 histories you have 2 decisions, 1 or 0, there are 28 = 256 possible strategies. One Possible strategy in look up table: But there are 255 more
Each agent gets S strategies drawn randomly from the list of possible strategies. The standard assumption is that each person has 2 strategies (if they have more ~ to adding players).That is for each of the 8 histories, you would have 2 complete mappings to decision space. • One strategy might be strategy (000–>0 and all else –>1) as one strategy and the strategy in the table as 2nd strategy. • Agents look at their strategies, calculate which would have worked best. Say 1 was winner last 2 periods. What happened in past after 11? If past record was 110 (suggesting that 0s switched and 1s held), go to 0. • There are lots of strategies: 2 raised to 2M, so m = 2, 16; m = 3, 81, m = 5, ~4 billion. But ½ of those are ‘polar opposites” 16 possible strategies.
Optimal Outcomes is to have about 50% choosing 0 and 1. Measure how far we fall short by standard deviation from coordinated solution. For ease of analysis take the representation where use -1 or 1. Then mean is 0, so σ2 measures fluctuations in the decisions and losses to society. With this metric if RANDOMLY choose strategies σ2 = N so σ2 /N = 1 If coordinate σ2 = 1 σ2 /N = 1/N –> 0 – ie add more people and you get close to 0 deviation Take example with 3 players RANDOM IDEAL COORDINATE • prob Value Sqrd prob Value Sqrd • 3 1/8 3 9 0 • 2 3/8 1 1 ½ 1 1 • 1 3/8 -1 1 ½ -1 1 • 0 1/8 -3 9 0 • σ2 (9+3+3+9 =24) /8 = 3 (1+1)/2 = 1 In general, if we have N of players 3 5 N • If random σ2 3 5 N If coordinate σ2 1 1 ... 1
Surprise is that with random strategies, result is closer to coordination than to random Simulations and analysis show that solutions depend on # of histories relative to # of players, α= 2M/N. This parameter measures how well the players cover the “history/possible strategy space”. If α is large there are many more histories 2M than players N, then σ2 –> N, so get close to random. No implicit coordination because lots of possible strategies or histories, then you learn from histories, get persistent behavior If α is small so that there are many more players N relative to strategies the choices effectively cover the space of possible strategies –>“herd effect” as some players duplicate others –> inefficient outcomes σ2 is larger than random ~ N ... Interpretation: with lots of players/strategies, agents “over react” to information and wipe out the value of information –no value to information If α is moderate get good results. It turns out that α = ~0.34 is ideal in simulations – gives losing/winning group close to N-1/2 σ2 /N –> 0 RATIONAL EXPECTATIONS EQUILIBRIUM WITHOUT RATIONAL EXPECTATIONS AND WITH CYCLES AND NO STEADY STATE since individuals keep changing and adapting in quest of a non-existing equilibrium.
This shows the inverse U function of the variance/N depending on the α and average success rate