Download
1 / 71
750 likes | 1.01k Views
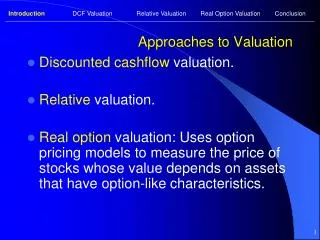
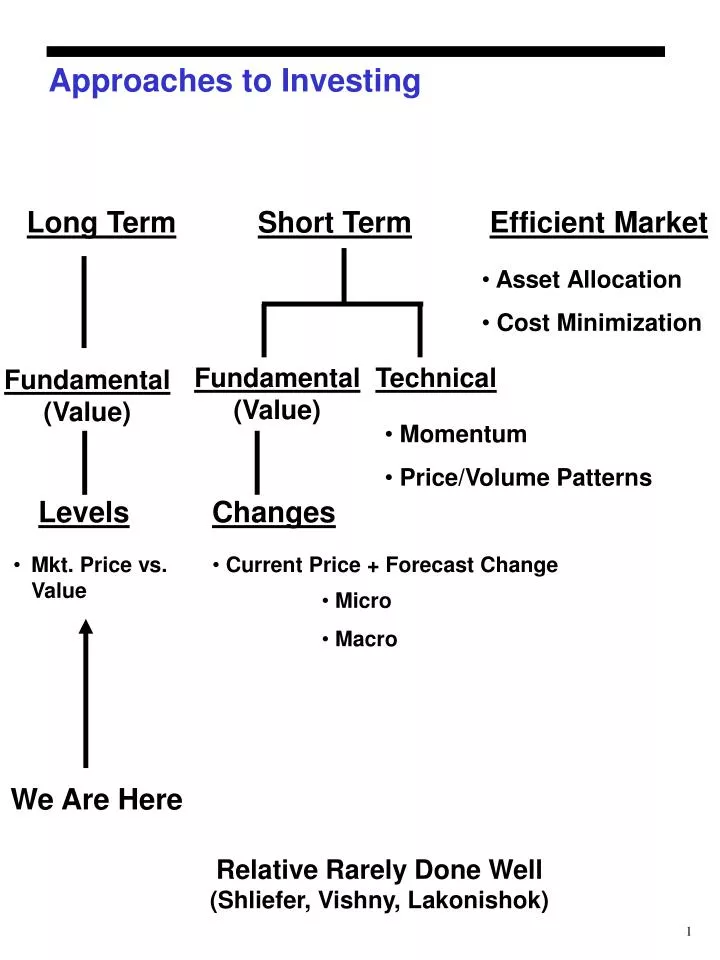
Approaches to Investing. Long Term. Short Term. Efficient Market. Asset Allocation Cost Minimization. Fundamental (Value). Technical. Fundamental (Value). Momentum Price/Volume Patterns. Levels. Changes. Mkt. Price vs. Value. Current Price + Forecast Change. Micro Macro.

E N D
Approaches to Investing Long Term Short Term Efficient Market • Asset Allocation • Cost Minimization Fundamental(Value) Technical Fundamental(Value) • Momentum • Price/Volume Patterns Levels Changes • Mkt. Price vs. Value • Current Price + Forecast Change • Micro • Macro We Are Here Relative Rarely Done Well(Shliefer, Vishny, Lakonishok)
Essentials of Value InvestingLong-Term Fundamental (Look at Underlying Businesses) Specific Premises: • Mr. Market is a Strange Guy • Prices diverge regularly from fundamental values • You Can Buy Underpriced Stocks • Fundamental values are often measurable • Fundamental Value Determines Future Price • Buying underpriced stocks plus patience implies superior returns
Value Investing in Practice Long-Term Fundamental (Look at Underlying Businesses) 1) Look Intelligently for Value Opportunities (low P/E, M/B) • Mr. Market is not Crazy about Everything • This is the first step not to be confused with Value Investing 2) Know What You Know • Not All Value is Measurable • Not All Value is Measurable By You (Circle of Competence) 3) You Don’t Have to Swing • Value Implies Concentration not Diversification (look for Margin of Safety) • At Worst, Buy the Market
Microsoft Valuation (in 2000) Assume: • 50% dividend payout (now zero) • 40% annual growth in sales, earnings (by 2010 – 28 times current size) • 15% discount rate (15% desired return) Terminal Value (depends on conditions in 2010 & beyond) Valuation: 2000 2010 Dividends 15%Value 85%Value Value = current price (i.e. 110) 80x earnings.
Value Investing the Approach Search(Look systematically for undervaluation) Value Review Manage Risk
Search Criteria • Obscure • Small Capitalization • Spin-Offs • Boring (Low Analyst Coverage) • Undesirable • Financial Distress, Bankruptcy • Low Growth, Low P/E, Low M/B • Industry Problems (Bad Loans, Regulatory Threat, Overcapacity) • Company Problem (Lawsuit, Poor Subsidiary Performance, Poor Year) • Disappointing (Long-Term Under performance) • Supply, Demand Imbalance - RTC • Privatizations
Stocks as Underpriced Assets • Stocks historically outperform bonds, etc. • Stocks are not that much more risky • But today… Stocks: E/P = 4% + 1½ % = 5½ % vs. 11% InflationHistorical Bonds: 5% vs. 3½ %at comparable inflation rates Notes: 4 ½ % vs. 2% Stock under valuation not so clear
Systematic Biases 1. Institutional • Herding – Minimize Deviations • Window Dressing (January Effect) • Blockbusters 2. Individual • Loss Aversion • Hindsight Bias • Lotteries
Loss Aversion - Example • In addition to whatever you own, you have been given $1000. Choose Between: • $1000 with Prob .5$ 0 with Prob .5 • $500 with Certainty • In addition to whatever you own, you have been given $2000. Choose between: • -$1000 with Prob .5 $ 0 with Prob .5 • -$500 with Certainty
Summary of Search • Low M/B, P/E, Growth • Disappointing Rtns • Institutional Psycho • Logical Rationale Search(Look systematically for undervaluation) • Obscure • Undesirable • Supply-Demand Imbalance Value Review Manage Risk
Value Investing the Approach Search(Look systematically for undervaluation) Value Review Manage Risk
Valuation Approaches – Ratio Analysis Cash Flow Measure Earnings (Maint. Inv. = Depr + A) EBIT (Maint. Inv. = Depr + A; Tax =0) EBIT - A (Maint. Inv. = Depr only) EBIT-DA (Maint. Inv. = 0) • Multiple • Depends on: • Economic position • Cyclical situation • Leverage • Mgmt. Quality • Cost of Capital (Risk) • Growth x Range of Error (100%+)
Valuation ApproachesNet Present Value of Cash Flow Value = CFt =CF0 t ( ) 11 + R 1R - g * t=0 Note: NPV Analysis encompasses ratio analysis (NPVdiseases are ratio analysis diseases) Note: NPV is theoretically correct In Practice: Revenues Parameters: • Market Size • Market Share • Market Growth • Price/Cost • Tech • Management Performance Forces: • Consumer Behavior • Competitor Behavior • Cost Pressures • Technology • Tech • Management Performance Margins Required Investments Investment Cash Flows Cost of Capital X NPV </> Market Value
Shortcomings of NPV Approach in Practice (1) Method of Combining Information 20 1 1 + … +CF20 + ... NPV = CFo +CF1 1 + R 1 + R Bad Information (Imprecise) Good Information (Precise) = Bad/Imprecise Information (2) Sensitivity Analysis is Based on Difficult-to-Forecast Parameters which co-vary in fairly complicated ways Cost of Capital Profit Margin Required Investment Growth
Valuation Assumptions Traditional: • Profit rate 6% • Cost of capital 10% • Investment/sales 60% • Profit rate +3% (i.e. 9%) • Growth rate 7% of sales, profits • Strategic: • Industry is economically viable • Entry is “Free” (no incumbent competitive advantage) • Firm enjoys sustainable competitive advantage • Competitive advantage is stable, firm grows with industry
Value InvestingBasic Approach to Valuation “Know what you know”; Circle of competence 1. Organize valuation components by reliability Most Reliable Least Reliable 2. Organize valuation components by underlying strategic assumption No Competitive Growing CompetitiveAdvantage Advantage
Basic Elements of Value Strategic Dimension Growth in Franchise Only Franchise ValueCurrent Competitive Advantage Free EntryNo Competitive Advantage Asset Value Earnings Power Value Total Value Reliability Dimension • Tangible • Balance Sheet Based • No Extrapolation • Current Earnings • Extrapolation • No Forecast • Includes Growth • Extrapolation • Forecast
Industry Entry - Exit IndustryMarket Value Net Asset Value Entry Chemicals $2B $1B Yes (P MV ) (Allied) $1.5B $1B Yes $1.0B $1B Stop Automobiles $40B $25B Yes (Sales MV) (Ford) $30B $25B Yes $25B $25B Stop Internet $10B $0.010B ? Remember, Exit is Slower than Entry.
Asset Value Basic Graham- Dodd Value Assets Reproduction Value Cash Book Book Accounts Receivable Book Book + Allowance Inventories Book Book + LIFO PPE 0 Orig Cost Adj Product Portfolio 0 Years R & D Customer Relationships 0 Year SGA Organization 0 Licenses, Franchises 0 Private Mkt. Value Subsidiaries 0 Private Mkt. Value Liabilities A/P, AT, AL Book Book Debt Book Fair Market Def Tax, Reserves Book DCF Bottom Line Net Net Wk Cap Net Repro Value
Asset Value Approaches Approach Graham Book Reproduction Opportunities None Limited More Extended Value in Practice Yes Yes Yes Industry Knowledge None None Extensive Stability/Reliability High Low Intermediate Goodwill 0 Historical Reproduction Debt Book Book Est Market(Low Debt)(0 Enterprise) (0 Enterprise) Remember, Low M/B is very hard to beat.
Asset Value Issues • Good adds value • Bad subtracts value • Management • Private Market Values • Potentially highly unstable (EBITDA multiples of Internet subs) • Reproduction vs. Book • Better where accountants misestimate • Tech trends • Real estate • Intangibles • M/B indicator close to M/Repro value • Improvement requires discipline • Non Viable Industries • Value = Zero (except NWC)
Asset Value Risk Management • Personal computer industry • Psychological experiments • Evidence of investment behavior in life • Private biases • Catalysts • Takeover • Reorganization • Management change • Importance of industry knowledge • If don’t know, don’t play (Circle of Competence) • Hedging • Limited Ultimately, “Margin of Safety” is risk management tool (Otherwise diversify)
1 Cost of capital * Earning Power Value • Basic Concept – Enterprise value based on this years “Earnings” • Measurement • Earnings Power Value = “Earnings” • Second most reliable information earnings today • Calculation • “Earnings” – Accounting Income + Adjustments • Cost of Capital = WACC (Enterprise Value) • Equity Value = Earnings Power Value – Debt. • Assumption: • Current profitability is sustainable
Earning Power Value Adjustments “Earnings” = EBIT (From Financial Statement) + One Time Charge Adjustment (if charges before tax average 20% of EBIT – 5 years – then reduce EBIT by 20%) +Cyclical Adjustment (calculate peak-to-trough EBIT variation – say 20% of average. If a peak subtract 29% of EBIT) +Tax Adjustment (apply average tax rate to EBIT – debt tax shield in WACC) + Depreciation Adjustment (Depr + Amort – Zero Growth Capex) + Subsidiary Earnings Adjustments + Other Adjustments (Temporary Problem, Unused Pricing Power).
Earning Power Value Calculation (Fraction of Debt) (RD) (1-Tax) + (Fraction of Equity) (Cost of Equity) WACC = Cost of Capital = Fraction of Debt = 1- Fraction of Equity Actual or Potential Zero Growth Capex = Actual Capex - Growth Capex Growth Capex = (PPE/Sales) * Sales Balance Sheet
Earning Power and Entry - Exit Value Lost to Poor Management and/or Industry Decline Case A: Asset Value EP Value Free EntryIndustry Balance Case B: Asset Value EP Value Consequence of Comp. Advantage and/or Superior Management Case C: Asset Value EP Value “Sustainability” depends on Continuing Barriers-to-Entry
Franchise Value Calculation • (A1) Cost of Capital = 10% • (A2) Asset Value “AV” = 1200M • (A3) Earnings Power Value = 2400M = 240M X (1 / 10%) • “Earnings” • Competitive “Free Entry Earnings” = 120M • = Cost of Cap. X Asset V • = 10% x 1200 • Franchise Earnings = “Earnings” – “Free Entry Earnings” • = 240 - 120 • = 120 • (A4) Sales = 2000M (Tax Rate = 40%) Power Value = 2400M = 240M X (1 / 10%) • Franchise Margin = 120M ÷2000M = 6% after tax • Franchise Margin (pre-tax) = 10% • = (10% - 40% X 10% = 6%) • Tax • EP Value Implies Sustainable 10% Cost and/or Pricing Advantage
Earnings Power Value Issues • Nature and sustainability of barriers-to-entry (competitive advantage) • Sustainability of management quality • Quality of reinvestment opportunities • Value of cash • Subtract interest earned from • EBIT add • Cash to EP value • Inflation adjustment
“Real” Earning Power Value • “Real” Earnings = “Earnings” – Inflation driven Investment • “Real” Cost of Capital = WACC – Inflation Rate • Inflation Driven Adjustment = Net Assets (Not including ‘goodwill’ items) * Rate of Inflation • Example: • (A1) EP Value = 2400M = 240M * 10% • (A2) Net Assets (not including goodwill) = • Cash + AR + Inv. + PPE – A/P – AL – AT = 800M • (A3) Inflation rate = 2% • Inflation Driven Adjustment = 2% * 800M = 16M • “Real” Earnings = 240M – 16M = 224M • “Real” Earnings Power = 224 = 224 = 2800M • 10% - 2% 8%
Summary of Basic Valuation Compute: Asset Value (Most reliable) EP Value (Second most reliable) Case A:Asset Value³ EP Value Value = EP Value (500M) (300M) + Catalyst Value Case B:Asset Value = EP Value Value = 500M (500M) (500M) Case C:Asset Value£EP Value Value = Asset Value (500M) (1000M) + Sustainable Fraction of Franchise Value (1000M-500M)
Summary of ValuationStrategic vs. Traditional Approach National Income, Growth, Consumer Trends Market Size Estimate Traditional Competitive Responses; Entry/Exit Market Share Revenue Technology, Costs; Prices; Input Costs Operation Margin Oper Income (EBIT) Investment Cash Flow Technology, Growth Financial Market Conditions; Risks Cost of Capital NVP Value Strategic: Is this the South Bronx of the Investment World?
Basic Strategy FrameworkPorter Five Forces – Probability Determinants Substitutes Suppliers Customer Industry Competition Entrants Four Forces too many
Strategic Investment Forces • Entry-Expansion – Barriers-to-Entry “Incumbent Competitive Advantage” Does this company enjoy competitive advantage that is significant? • Yes – Being industry creates value • No – Efficient Operation may create value • Others enjoy advantage – stay out. (Being in industry destroys value) What about entrant advantages? • No good – after entry you become incumbent. • Existing Competitor Dynamics Degree of Competition (Phillip Morris) • Share the Wealth (Workers, Customers) Value Chain Dynamics
Consequences of Free EntryCommodity Markets (Steel) $/Q “Economic Profit” ROE (20%) > Cost of Capital Entry/Expansion Supply Up, Price Down AC Price Q Firm Position (Efficient Producers) ROE = 12% No Entry No Profit $/Q AC Price Q Firm Position
Consequences of Free EntryDifferentiated Markets (Luxury Cars) $/Q “Economic Profit” ROE (20%) > Cost of Capital Entry/Expansion Demand for Firm shifts left (Fewer sales at each Price) AC Demand Curve Q Firm Position ROE = 12% No Entry No Profit $/Q AC Demand Curve Q Firm Position
Barriers to Entry Incumbent Cost Advantage Entrant Incumbent Sources Proprietary Tech(Patent, Process) Learning Curve Special Resources No “Economic” Profit ROE = 12% No Entry “Economic” Profit ROE = 20% • Not Access to Capital • Not Just Smarter
Barriers to Entry Incumbent Demand Advantage Entrant Incumbent Sources No “Economic” Profit ROE = 12% No Entry Higher Profit, Sales ROE = 20% • Habit (Coca-Cola) • High Frequency Purchase • Search Cost (MD’s) • High Complex Quality • Switching Cost (Banks, Computer Systems) • Broad Embedded Applications
Barriers to Entry Economies of Scale • Require Significant Fixed Cost (Internet) • Require “Temporary” Demand Advantage • Not the Same as Large Size (Auto + Health Care Co)
Barriers to Entry Economies of Scale • Advantages are Dynamic and Must be Defended • Fixed Costs By: • Geographic Region (Cohrs, Nebraska Furniture Mart, Wal-Mart) • Product Line (Eye Surgery, HMO’s) • National (Oreos, Coke, Nike, Autos) • Global (Boeing, Intel, Microsoft)
Barriers to Entry - Sustainability • Static Demand Advantages • Tied Customers • Exploitation • Pricing, focus on “Own” Customers • No advantage with Virgin customers • Shrinkage over time as base changes • Cost efficiency in “Own” technology • No advantage with virgin technology • Shrinkage with technology change Static Cost Advantages • Economies-of-Scale + Dynamic Demand Advantage • Principal sustainable advantage • Constant vigilance
Other Barriers-to-Entry • Government, Regulatory, Public (Lead based Gas Additives; Cigarettes) • Informational (Who Knows What) (Banks, Financial Services, HMO’s)