Download
1 / 14
140 likes | 248 Views
Technology and the Wilshire Way: an analysis of the Texas STaR Chart survey results 2006-2010. Julia Wilson EDLD 5306 June, 2010. On the Agenda. What is the STaR Chart? LRPT (Long Range Plan for Technology) STaR Chart domains A look at Wilshire’s data

E N D
Technology and the Wilshire Way:an analysis of the Texas STaR Chart survey results 2006-2010 Julia Wilson EDLD 5306 June, 2010
On the Agenda • What is the STaR Chart? • LRPT (Long Range Plan for Technology) • STaR Chart domains • A look at Wilshire’s data • Comparison of campus data 2006-07 to 2009-10 • What’s working • What are our challenges? • Next steps
Each year, Wilshire teachers, along with teachers in public schools across the state, are asked to complete the STaR survey, which measures technology preparedness in our school and our district. (TEA, 2006)
The STaR Chart data is intended to answer two main questions: • Are teachers and schools working toward the goal of the LRPT? Long Range Plan for Technology 2006-2010 • 2. Are students working toward mastery of tech literacy objectives in the TEKS? Technology TEKS
STaR Chart data has been collected since the 2006-2007 school year • Data is disaggregated at the campus, district and state levels • Classifications are assigned for each of the four domains: • Early Tech (6-8) • Developing Tech (9-14) • Advanced Tech (15-20) • Target Tech (21-24) THE DATA
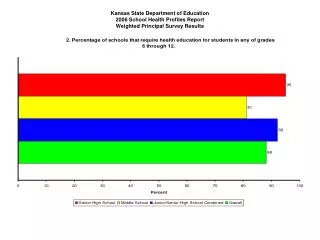
How we Stack Up: STaR Chart Comparison Over 4 Years
According to the data from 2006 to 2010, our campus shows the greatest strength in • Infrastructure for Technology • 4 computers per classroom • over 75 computers in our two labs and the library. • document cameras, video recorders, digital cameras, and SMART Boards in most classrooms • Scanner, poster maker, FLIP video and digital cameras, podcasting equipment • excellent connectivity • a wide variety of software for use (Office 2007, Photostory, SMART Technologies) • District access to robust classroom website applications
Where we fall short: • Educator Preparation • 2006-07: High Early Tech (8) • 2007-08: Low Developing Tech (10) • 2008-09: No Change • Developing – “Use of technology is for administrative tasks and classroom management. There is use of online resources.” • Source: TEA (2006). Texas STaR chart. Instructional Materials and Educational Technology Division • Focus: • Teaching and Learning: • 2006-07: Mid Developing (12) • 2007-08: No Change • 2008-09: -1 • 2009-10: Return to 2006-07 level (12) • Developing – “Instruction is teacher-directed . . . students use technology to access electronic information and develop communication and presentation projects. There is minimal use of technology in foundation TEKS.”
Next Steps: How do we make technology a part of student-centered learning?
Start small. one good lesson can change the way your students think about a concept! Use your resources. TCI, Technology Facilitator, colleagues JUMP IN! Take a PD, then open up the application and start plugging away! Practice makes perfect. Share! Your efforts can help ALL of our students! We use our best practices, and remember that we are learners as well as teachers.
“We all know that life will be very different by 2100. Will school?” -- Marc Prensky (2008). Adopt and adapt: shaping tech for the classroom. Edutopia: The George Lucas Educational Foundation