Download
1 / 78
780 likes | 1.22k Views
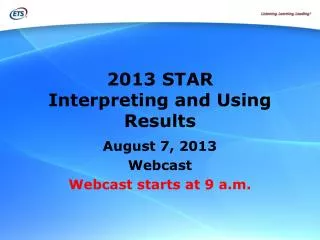
2010 STAR Interpreting and Using Results. August 11, 2010 Webcast Webcast starts at 9:00 a.m. Objectives. Workshop participants will be able to: Describe the purposes of STAR reports Interpret STAR results Explain key statistics Compare and contrast types of reports

E N D
2010 STARInterpreting and Using Results August 11, 2010 Webcast Webcast starts at 9:00 a.m.
Objectives Workshop participants will be able to: • Describe the purposes of STAR reports • Interpret STAR results • Explain key statistics • Compare and contrast types of reports • Identify proper uses of reports Post-Test Workshop
Agenda • What’s New? • Results and Statistical Analysis • Using Results • Summary and Internet Reports • Data CDs • Individual Student Reports • Early Assessment Program Post-Test Workshop
California Modified Assessment (CMA) reports Scale score, performance levels for Grades 6–8 English−Language Arts (ELA) Grades 6–7 mathematics Grade 8 science Percent correct for ELA grade 9 Life Science, grade 10 Algebra I What’s New in 2010 Manual (M) 2 Post-Test Workshop
More What’s New M 2 • Standards-based Test in Spanish (STS) reports • Scale score, performance levels for • Grades 5–7 Reading/Language Arts (RLA) • Grades 5–7 mathematics • Percent correct for • Grades 8–11 RLA • Grades 7–11 Algebra I • Grades 8–11 Geometry • Subgroup Summary: Ethnicity • Grade 11 – Early Assessment Program (EAP) – California Community Colleges added Post-Test Workshop
Quiz Question 1 Which of these tests had scale scores reported for the first time in 2010? • CST for World History • CAPA for Science • CMA for math grade 7 and science grade 8 • STS for math grade 7 and Algebra I Post-Test Workshop
Quiz Question 1 Which of these tests had scale scores reported for the first time in 2010? C. CMA for math grade 7 and science grade 8 Post-Test Workshop
Results: Purposes of STAR Reports M 4 • Report progress of students toward proficiency on the state’s academic content standards • Notify where improvement needed • To help students’ achievement • To improve educational programs • Provide data for state and federal accountability programs Post-Test Workshop
Results: Performance Levels M 8−10 • State Goal: All students score at proficient or higher • CAPA Proficient: 35 or higher scale score • 350 or higher scale score • All CST • STS, grades 2–7, excluding Algebra I • CMA, grades 3–8, excluding Algebra I Post-Test Workshop
Results: Other Performance Levels M 8−10;Appendix B • Advanced • Basic cut score • CAPA: 30 • CST: 300 • CMA, grades 3–8: 300(excluding Algebra I) • STS, grades 2–7: 300(excluding Algebra I) • Below basic • Far below basic • Cut points vary for advanced and below basic by • Subject • Grade Post-Test Workshop
Results: Scale Scores M 8−10 • Scale scores allow same score to mean same thing across test versions within grade and content area • Accounts for differences in difficulty • Scale score ranges by program: • CST, CMA (grades 3–8, excluding Algebra I), STS (grades 2–7, excluding Algebra I): 150–600 for each grade and subject • CAPA: 15–60 for each level and subject Post-Test Workshop
Results: Equating M 8 • Psychometric procedure • Adjusts for test difficulty • Additional information in the CST Technical Report on the CDE Web site Post-Test Workshop
Results: Reporting Clusters(Content Areas) M 8−12;Appendix A • Three to six clusters for each subject • May be useful as indicators of individual or group strengths and weaknesses • But . . . Reporting clusters should be interpreted with caution Post-Test Workshop
Results: Cluster Percent Correct Available for 2010 M 8−12;Appendix A • CST: all • CMA: • Grades 3–8, excluding Algebra I • STS: all Post-Test Workshop
Results: Reporting ClusterCautions M 8−12;Appendix A • Based on small numbers of items; therefore, may not be reliable or generalizable • NOT equated from year to year • Should not compare reporting cluster percent correct from year to year Post-Test Workshop
Interpreting Reporting Clusters or Content Areas in the Same Year M 8−12;Appendix A • Compare to percent-correct range of proficient students statewide Post-Test Workshop
2010 CST Reporting Clusters: Number of Questions and Average Percent Correct M Appendix A To be finalized with complete data in 2010 Post-Test Guide, after August 16. Post-Test Workshop
Examples—Interpreting Reporting Clusters for the CST for Geometry M 11 Post-Test Workshop
Quiz Question 2 What is a scale score? • Percent correct of all questions • Mean percent correct of all questions • An adjustment of this year’s and last year’s raw scores to show changes • An adjustment of the raw score to account for differences in difficulty Post-Test Workshop
Quiz Question 2 What is a scale score? D. An adjustment of the raw score to account for differences in difficulty Post-Test Workshop
Using Results M 4 • For instructional decisions with other data • Used in Academic Performance Index (API) calculations: CSTs, CAPA, CMA (only grades 3–8, excluding Algebra I) • Used in adequate yearly progress (AYP) calculations, ELA and mathematics: • Grades 2–8, CSTs • Grades 3–8, CMA (excluding Algebra I) • Grades 2–8 and 10, CAPA Post-Test Workshop
Year-to-Year ComparisonsDo Compare CSTs:Same Grade and Same Content Area M 13−16 • Mean scale score • Same content and grade, varying years • Percent in each performance level • Same content by grade across years • e.g., 2009 ELA grade 10 with 2010 ELA grade 10 Post-Test Workshop
Year-to-Year ComparisonsDo Compare CSTs:Percent Proficient and Advanced M 13−16 • Percentage of students scoring at PROFICIENT and above • For a given grade and subject, e.g., Percent proficient and above for grade 3 math in 2009 and 2010 • For a given subject and aggregated grades, e.g., Percent proficient and above for grades 2– 6 mathematics in 2009 and 2010 • Across grades and a subject, e.g., Percent proficient and above in all courses and all grades Post-Test Workshop
Year-to-Year ComparisonsDON’T Compare M 13−16 • Individual scale scores or statistics based on scale scores for different grades or content areas • Subjects by grade are independently scaled • Different content standards are measured in different grades • Cohorts across grades • Across tests • CMA grades 6−11, STS grades 5−11 to previous years • CAPA, CMA grades 3−5, STS grades 2−4 to years before 2009 Post-Test Workshop
Example—Using CST Results to Compare Grade Results from Year to Year M 14 Post-Test Workshop
Quiz Question 3 What is the best comparison for CST scores of students within a middle school? • 2009 mean scale scores for ELA of a cohort of grade 7 students with 2010 scale scores for ELA of the same students in grade 8 • 2009 mean scale scores for ELA for grade 8 students with 2010 mean scale scores for ELA for grade 8 students • 2009 mean percent correct scores for ELA with 2010 percent correct scores for ELA for the same students in grade 8 • 2009 mean percent correct scores for ELA for grade 8 students with 2010 mean percent correct for ELA for grade 8 students Post-Test Workshop
Quiz Question 3 What is the best comparison for CST scores of students within a middle school? B. 2009 mean scale scores for ELA for grade 8 students with 2010 mean scale scores for ELA for grade 8 students Post-Test Workshop
Quiz Question 4 Which is the best comparison of cluster scores for a single student? Compare . . . • To proficient students statewide • One cluster to another, same year • The same cluster to the same cluster, different years • To the average percent correct of all students in a class Post-Test Workshop
Quiz Question 4 Which is the best comparison of cluster scores for a single student? Compare… • To proficient students statewide Post-Test Workshop
Aggregate (Summary) Reports M 18−22 • What are they? • Student Master List Summary • Student Master List Summary End-of-Course (EOC) • Subgroup Summary • Report Emphasis: CSTs • Criterion-referenced tests • Progress is measured in percent of students scoring proficient and advanced Post-Test Workshop
Student Master List Summary M 19–20, M 28−34 • By grade • CSTs, CMA, CAPA, and STS • Lists subjects • % and # at each performance level • Mean scale score (CST, CAPA, CMA grades 3–8 [not Algebra I], STS grades 2–7 [not Algebra I]) • Reporting cluster: mean percent correct (CST, CMA grades 3–8 [not Algebra I], STS) Post-Test Workshop
Student Master List Summary M 34 Grade 7 Example Post-Test Workshop
Student Master List SummaryBasic Statistics M 28−34 Post-Test Workshop
Who Counts? Number Enrolled M 28−34 • Total CST/CMA and CAPA multiple-choice answer documents submitted as scorable • Minus • Documents marked as “Student enrolled after the first day of testing and was given this test” Post-Test Workshop
Who Counts? Number Tested M 30−32 • All CST, CMA, CAPA, STS answer documents with one or more answers • Plus • Z = Tested but marked no answers • Not included • A = Students absent • E = Not tested due to significant medical emergency • P = Parent/guardian exemptions • T = Enrolled first day, not tested, tested at previous school • Students with inconsistent grades • Non–English learners who took the STS Post-Test Workshop
Who Counts? Number and Percent Valid Scores M 30−32 • Number Valid Scores • For the subject, number of students tested at grade level who received a score for the test (that is, a scale score or percent correct). • Percent Valid Scores • For the subject, number of valid scores divided by the number of students tested. • Not included: • Incomplete tests • Modified tests • Non–English learners who took the STS • Unknown EOC mathematics (except grade 7 mathematics) or science tests • Inconsistent grades Post-Test Workshop
Who Counts? Number Tested with Scores M 30−32 • All tests taken, including those taken with modifications, that receive a score • Not included: • Incomplete tests • Non–English learners who took the STS • Unknown EOC mathematics (except grade 7 mathematics) or science tests • Inconsistent grades Post-Test Workshop
Who Counts? Performance Levels M 30−32 • All CSTs, CAPA • CMA Grades 3–8, excluding Algebra I • STS Grades 2–7, excluding Algebra I • Advanced, proficient, basic, below basic • All valid scores falling in the performance level • Far below basic • All valid scores falling in the performance level • CSTs taken with modifications (in aggregate reporting and accountability only) Post-Test Workshop
Student Master List SummaryPerformance Levels M 31 Post-Test Workshop
Student Master List SummaryReporting Clusters M 31−32 Compare to: Average percent correct range for students statewide who scored proficient on the total test Post-Test Workshop
B = Blank C = Copied prompt I = Illegible L = Language other than English R = Refusal T = Off Topic W = Wrong prompt (prompt from an earlier administration) Student Master List Summary:Writing M 32 Post-Test Workshop
Student Master List Summary: End-of-Course (EOC) CST, CMA, and STS M 35−40 • By subject • Lists each grade eligible to take test • Mathematics (Grades 7–11) • CST General Math, Algebra I, Geometry, etc. • CMA Algebra I • STS Algebra I and Geometry • CST Science (Grades 9–11) • Earth Science, Biology, Chemistry, etc. • CST History–Social Science (Grades 9–11) • World History • Same statistics as grade-level Student Master List Summary Post-Test Workshop
Student Master List Summary End-of-Course M 40 CST Biology Example Post-Test Workshop
Subgroup Summary:CSTs, CMA, CAPA, and STS M 41−59 • Disability status • Based on disability status for CST, CMA, STS • CAPA: each disability type • If missing, correct with demographic data corrections • Economic status • Based on NSLP eligibility or parent education level • Gender • English proficiency • Ethnicity • Ethnicity for Economic Status (only for CSTs, CMA grades 3–8, and CAPA) Post-Test Workshop
Subgroup Summary: Gender Grade 5 Example Post-Test Workshop
Subgroup Summary: Ethnicity • From answer document sections 8 and 9: • Hispanic or Latino? • Race: grouped and worded differently • May cause counts to differ from previous year • Federal Reporting Requirement • Two or more races (instead of “unknown”) Post-Test Workshop
Subgroup Summary: Ethnicity for Economic Status M 64 Ethnicity for Economically Disadvantaged CST Grade 6 Example Post-Test Workshop
Subgroup Summary: Ethnicity for Economic Status M 60−64 Example: Economically disadvantaged for each ethnicity Post-Test Workshop
Subgroup Summary: Ethnicity for Economically Disadvantaged M 60−64 Post-Test Workshop