Download
1 / 21
210 likes | 346 Views
Using the Parkride2.mac Macro to Model Park and Ride Demand in the Puget Sound Region. 22 nd International Emme Users’ Conference September 15-16, 2011, Portland, Oregon Mark Charnews. 2. 2. Park and Ride Method.

E N D
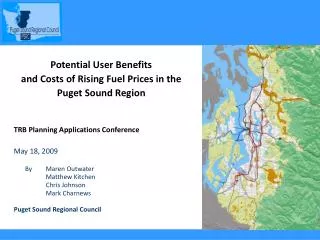
Using the Parkride2.mac Macro to Model Park and Ride Demand in the Puget Sound Region 22nd International Emme Users’ Conference September 15-16, 2011, Portland, Oregon Mark Charnews
2 2 Park and Ride Method In order to improve park and ride lot utilization in the PSRC travel demand model, INRO provided two macros, Parkride2.mac (alpha version), and Avgprtime.mac (beta version) for testing in the model. This presentation discusses the macros, results and implications for future work.
3 3 Park and Ride Method • Transit trips are an output of the Mode Choice Model and consist of Walk Access and Auto Access Trips. • Walk Access transit trips are straightforward, trips are made for each ij zonal pair and transit skim data is saved for the next iteration of the Mode Choice model
4 4 Park and Ride Method Transit Auto Access is more complicated. The process starts with a Trip Table from Mode Choice.
PRESENTATION TITLE HERE 5 5 Park and Ride Lot Coding Each Park and Ride Lot is coded as a centroid in in the highway network. Centroid links to and from the park and ride lot are coded allowing for all highway modes reflecting the distance from the center of the lot to the highway system.
6 6 Park and Ride Model Process Park and Ride lots are then seen as intermediate destinations in the trip from origin to destination.
7 7 Parkride2.mac alpha version • The Parkride2.mac macro (Alpha version) is then used to split the Auto Access trips into the: • Auto part, • - origin zone to Park and Ride Lot centroid, • and the Transit part. • - Park and Ride Lot centroid to destination zone. • The macro uses a logit intermediate destination choice model with explicit parking capacities and “attractiveness” factors to determine which parking lots are used for each ij pair.
8 8 Parkride2.mac Parkride2.mac declarations: t1 – origin TAZs (1,956) t2 – Park and Ride lot Centroids (1001,1200) t3 – Destination TAZs (1,956) r1 – Maximum constraint violations (10) r2 - Maximum number of iterations (15)
9 9 Parkride2.mac Parkride2.mac arguments: 1 Total Demand for Park and Ride mode 2 Conductivity Matrix for Auto 1st leg * 3 Attractiveness factor for parking lot K (.01 – 4.0) 4 Conductivity Matrix for Transit 2nd leg * 5 Parking Lot capacities Results: 6 Parking lot usage 7 Auto demand matrix (1st leg) 8 Transit demand matrix (2nd leg) 9 OD pair multipliers 10 Parking lot multipliers
10 10 Parkride2.mac The Connectivity matrix for the first leg (Auto) is calculated: exp(-0.199 * HBW SOV (by income) bidirectional cost) The Connectivity matrix for the second leg (Transit) is calculated: exp(-0.034 * Total Transit time) The ratio of -0.199 to -0.034 makes travel by auto 6 time more onerous than travel by bus so that the traveler just does not maximize travel by auto and then selects the closest park and ride to his destination.
11 11 Parkride2.mac Parkride2.mac saves auto and transit legs in separate matrices.
12 12 Avgprtime.mac Beta version Now that Auto and Transit demand have been estimated and split into the two legs, the results are added to the auto and transit demand matrices and assignments are run. Now a set of transit skims consistent with the results of parkride2.mac need to be developed using a beta version of a macro called Avgprtime.mac (from INRO).
13 13 Avgprtime.mac Avgprtime.mac (beta) arguments: 1 Conductivity matrix for Auto 1st leg 2 Conductivity matrix for Transit 2nd leg 3 Impedance matrix for the 1st leg of the trip (auto) 4 Impedance matrix for the 2nd leg of the trips (transit) 5 Parking lot multipliers (from Parkride2.mac) 6 OD-Pair multipliers (from Parkride2.mac) 7 Park and Ride demand matrix Results: 8 Average Auto Impedance matrix (result 1st leg) 9 Average Transit impedance matrix (result 2nd leg)
14 14 Avgprtime.mac Auto and transit skims are then calculated as a weighted average of all the park and ride paths from i to j.
15 15 Model Complications Some Details: PSRC Model has auto skims for four income groups. Also has five transit sub-modes: Ferry Commuter Rail Light Rail Premium Bus Local Bus 20 sets of skims.
16 16 Results Park and Ride Usage with Parkride2.mac
17 17 Results Park and Ride Usage with Parkride2.mac with Attractiveness Factors
18 18 Conclusions Conclusions: The Parkride2.mac macro works well in allocating park and ride trips with the attractiveness factor dialed in. The Avgprtime.mac macro provides reasonable skims for mode choice. Further review of the ratio of auto time to transit time needs to be made.
19 19 Observations Observations: Park and Ride usage does not always reflect actual park and ride trips. Vehicles in park and ride lot may be left from carpooling with others. People are dropped off at Park and Ride lots to take the bus, “Hide-a-Ride”. Need to obtain bus boardings at park and ride lots from APC/AVL data. PSRC Household survey data suggests about 30 percent of auto access trips are to non park and ride locations. Informal park and rides. While park and ride trip levels match observed usage, is the pattern of the origin of the trips duplicated?
21 21 Parkride2.mac Avgprtime.mac Questions? Mark Charnews, PhD mcharnews@psrc.org 206.971.3285