Download
1 / 40
400 likes | 404 Views
Explore the climate and hydrology of the Puget Sound in 2020/2040 and understand the impacts of climate change on water supply. Discover how mid-term forecasts can improve water supply management for people and fish.

E N D
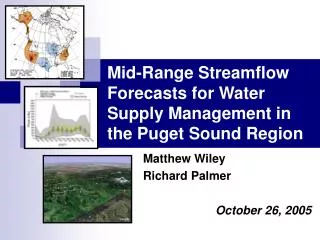
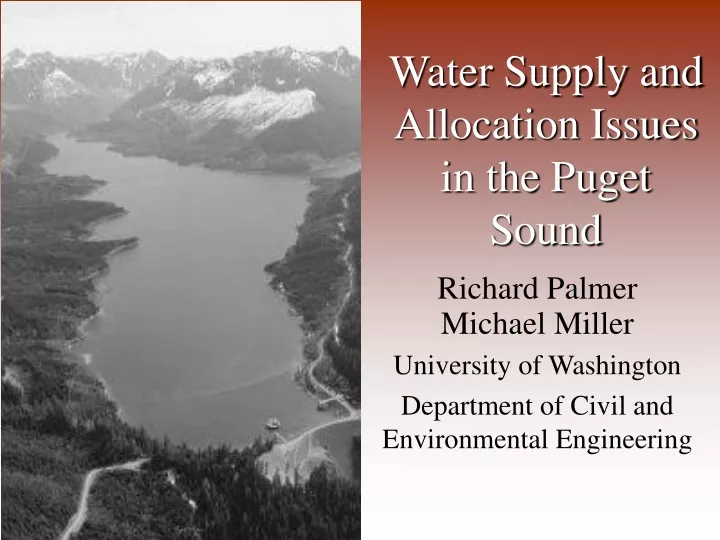
Water Supply and Allocation Issues in the Puget Sound Richard Palmer Michael Miller University of Washington Department of Civil and Environmental Engineering
Objective and Outline • What will be the climate and hydrology of the Puget Sound in 2020/2040 and what are the impacts of climate change on water supply issues? • How can mid-term forecasts improve management of water supplies for people and fish?
Objective and Outline • What will be the climate and hydrology of the Puget Sound in 2020/2040 and what are the impacts of climate change on water supply issues? • How can mid-term forecasts improve management of water supplies for people and fish?
Current state of climate modeling • Climate models are currently capable of credibly simulating present climate at the continental scale. • Models are continually improving, yet key physical relationships remain poorly understood, the water vapor/cloud formation and feedback process being the most significant. • Greater resolution and more complex parameterization of physical processes will continue as computing power increases and study continues. • Models are not predictions of future, but can be considered as credible simulations of a multitude of possible futures.
GCMs - General Circulation Models • IPCC discusses 34 GCMs • Coupled Model Intercomparison Study examines 29 in more detail • Compares GCMs via historical observations for air temperature, precipitation, sea temperature, air pressure, ice extent. • We have selected nine of the more prominent models to demonstrate GCM selection process
Evaluation of Climate Change Climate Shift Meteorological Data Hydrology Model Demand Model Operations Model
Temperatures will increase by 2° C by 2040, with higher temperatures in the summer Precipitation will increase in the winter and decrease in the summer.
Sultan River Inflows into Spada Reservoir Average Annual Hydrograph
Tolt River Inflows into Tolt Reservoir Average Annual Hydrograph
Cedar River Inflows into Chester Morse Reservoir Average Annual Hydrograph
Green River Inflows into Howard Hansen Reservoir Average Annual Hydrograph
Ranked Cumulative Winter Flow (JFM) 2040 cfs-weeks 43% 32%
Ranked Cumulative Spring (AMJ) Flow 2040 cfs-weeks -30%
Results – Impacts on HydrologyPercent difference from current climate cumulative seasonal flows
Conclusions • Climate impacts on the four basins’ hydrology are similar • Average percent difference in seasonal flows • 2020 Winter : 28% 2020 Spring : -20% • 2040 Winter : 37% 2040 Spring : -31% • Absolute average percent difference • Sultan : 31% • Tolt : 18% • Cedar : 36% • Green : 32% • Average supply system impact is 15-17% increase in System Use (surface storage, groundwater and/or system shortfalls)
Climate Impact on Water Supply Average climate impact on Supply Used, Percent Difference from Current Climate
Possible Reactions to Climate Change Information • Supply • Tacoma to Seattle Connection (2nd Supply Project) • Seattle to Everett Connection • Water Reuse • Demand • Conservation Measures • Pricing • Change Service Base
Objective and Outline • What will be the climate and hydrology of the Puget Sound in 2020/2040 and what are the impacts of climate change on water supply issues? • How can mid-term forecasts improve management of water supplies for people and fish?
Why do a Forecast? • 6-month forecast applied to the PRISM models • Usefulness of forecasts • Why forecasts are useful • Who could use the forecasts • How are the forecasts developed • Examples of the forecasts • Future direction with the forecasts
Applying 6-month Forecast • Prior to a forecast • Water management decisions • 50 years of meteorological records • 73 years water supply and demand records • With a forecast • Water management decisions based on potential future conditions • Forecast continue using DHSVM and CRYSTAL for water supply and management
Usefulness of Forecast • For policymakers • M&I Demands • During below average conditions • Improve timing of water restrictions • Provide more information as to the type of restriction • HCPs • During above average conditions • Determine amount and length of large flow releases • During below average conditions • Revise timing of releases to minimize habitat damage
Usefulness of the Forecast • For water managers • During average and above average flow • Forecast potential of these resources • Discharge necessary to meet future flood control • During below average flows • Forecast initial drought conditions a couple months sooner • In the early summer months, forecasts could indicate when fall and winter flows will increase
Forecast Development • Developed by Andy Wood, Edwin Maurer, Arun Kumar, and Dennis Lettenmaier • NCEP Data • Bias Correction • Downscaling • DHSVM
NCEP Data • National Center for Environmental Prediction (NCEP) • Global Spectral Models (GSMs) • Hindcasts • Temperature and precipitation • 10 initial conditions • 21 years (79 – 99) • Forecasts • 20 ensembles • 6-month forecast
Downscaling • Forecasted meteorological data • Based on month from the historic 21-year record (79-99), most similar precipitation • Precipitation is scaled (multiplicative process) • Temperature is shifted (additive process) • Preformed to each month of each ensemble
DHSVM • Distributed Hydrologic Soil Vegetation Model (DHSVM) • Most recent year of actual data run prior to the forecast • To have the model set for the forecasted data. • Keep model run time reasonable
DHSVM Output • 20 forecasts of stream flow • Forecasts are compared to historic average flows • Comparison used to forecast higher or lower then average flow.
Summary • Climate Change • Initial results suggest significant impacts on water supply • Lower summer flows will challenge releases for both fish and folks • New management strategies are necessary • Future planning should include this impact
Summary on Forecasting • Forecasting with longer-range climate indicators offers promise Past forecasts did not provide sufficient lead time for certain times of year • Will have on line forecasts this quarter