Download
1 / 1
10 likes | 107 Views
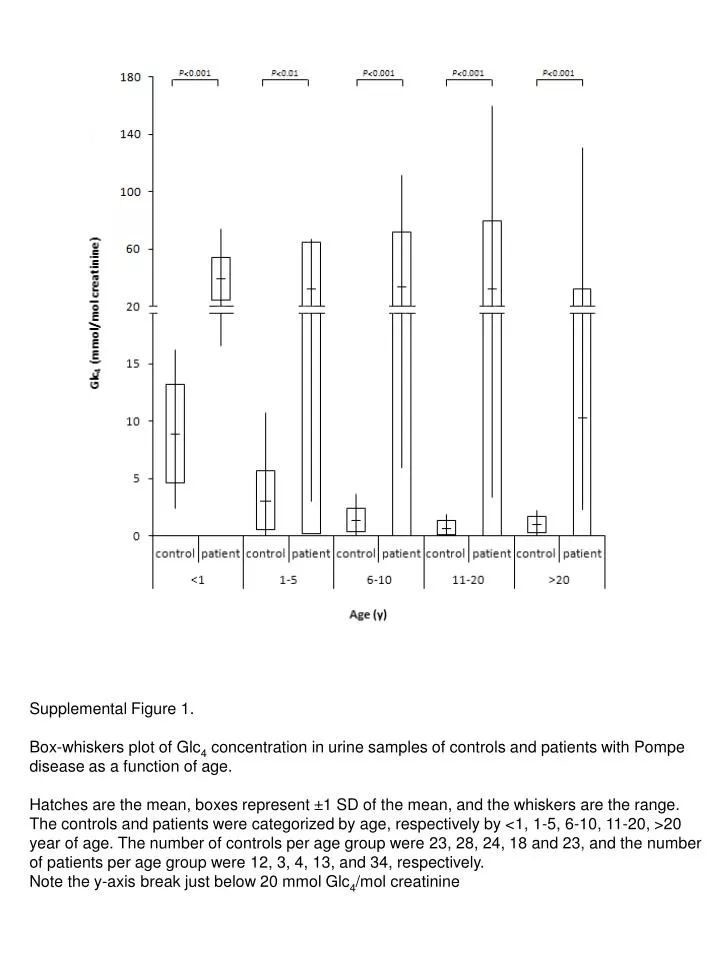
Supplemental Fi gure 1. Box-whiskers plot of Glc 4 concentration in urine samples of controls and patients with Pompe disease as a function of age.

E N D
Supplemental Figure 1. Box-whiskers plot of Glc4 concentration in urine samples of controls and patients with Pompe disease as a function of age. Hatches are the mean, boxes represent ±1 SD of the mean, and the whiskers are the range. The controls and patients were categorized by age, respectively by <1, 1-5, 6-10, 11-20, >20 year of age. The number of controls per age group were 23, 28, 24, 18 and 23, and the number of patients per age group were 12, 3, 4, 13, and 34, respectively. Note the y-axis break just below 20 mmol Glc4/mol creatinine