Download
1 / 31
310 likes | 478 Views
2013 Westchester Child Care Report Card Challenge. Welcome – Council Board of Directors. Investing in Our Children’s Future. Today’s Program. Landscape of Westchester Child Care . U.S. and NYS trends Westchester child care sector Parent child care survey Report card grades Supply Cost

E N D
2013 Westchester Child Care Report Card Challenge
Welcome – Council Board of Directors Investing in Our Children’s Future
Today’s Program Landscape of Westchester Child Care • U.S. and NYS trends • Westchester child care sector • Parent child care survey • Report card grades • Supply • Cost • Quality • Q and A • CCCW Public Policy Agenda Westchester Child Care Report Card
Shift in thinking about early learning at national and state levels • Early Learning Plan • New CCDF regs • NYS UPK$ • ELCG application
Our Child Care Sector - Supply • 757 vs. 761 prior year • Slots up 1% to 32,193 - up 14% in 5 yrs • Centers are 56% of all slots • Half as many family providers as a decade ago – 343 to 179 • Group family has doubled to 264 • School age at lowest in decade at 109
Our Child Care Sector - Supply Little change in available slots for different age groups over past 5 yrs – • Infant at 8% • Toddler at 12% • Preschool at 38% • School age at 42%
Our Child Care Sector - Affordability Costs up since 2007 but 2013 < 2012 • Centers • Infant $16,328;Toddler $14,872 and Preschool $13,260 • Family/Group Providers • Infant $13,884;Toddler $12,948 and Preschool $12,532 • School Age $5,096
Our Child Care Sector - Affordability • Child Care Subsidy Program • Parent share down and now back up • 33% in 2004 down to 10% in 2009 • 27% this year • No waiting list • Title XX closed in spring 2010 to new families • Westchester Child Care Scholarship ended in 2010
Our Child Care Sector - Affordability • Fed $ to NYS for child care subsidy down • DCAP maximum still at $5k and not user friendly • No change in tax credits for dependent care • Public funding for early learning in U.S. much less than most other countries
Our Child Care Sector - Quality • Nationally Accredited programs down 50% since 2005, now at 28 • Strong interest in QSNY • Contracted to recruit 38 and over 90 applied • More interest in quality improvement work • Early Literacy – 21 classrooms/12 providers • All improved quality – from 8 at “5” + to 30
Parent Child Care Survey • More feedback from parents • Survey questions modeled after earlier research study in 2006 • Electronic and hard copy • August – September • Our parent referral list, County government, CBO, Journal News and other media
Survey Respondents 731 • South (45%); North (31%); Central (24%) • 68% with 3 or 4 family members • 95% working outside the home • 2 parents 50% • Single parent 37% • 1 parent home/1 working outside 8%
Survey Respondents • 87% with children in some kind of care • All ages of children but only 14% had infants • 60% with preschooler and/or K to 6th grader • Household income very skewed • 42% at $39k or less • 27% at $102k or more including 7% over $200k • 8% would be income-eligible for Title XX
Type of Child Care Being Used • Majority using regulated – 87% • Centers 57% • School Age 21% • Family/Group Family 19% • Lots of informal care & combinations – • Relative in child’s home 16% • Relative in his/her home 15% • Nanny/babysitter 11% • M-F, 7 am to 6 pm (62%)
Leading Choice Factors • Proximity to home or work (28%) • Hours (11%) • Cost and Kids Look Happy (10%) • Overall quality for Pre and K-6th (10%) • Quality indicators (2% to 4%)
Cost of Child Care • Cost went up with family income • Big range • 18% paying $0 - $24 and 8% paying $500-$900+ • Largest group paying $100 - $200 (24%) • 40% paying $100 or less (combining cost categories) • 13% paying $300 - $500
Paying for Child Care • 57% had trouble paying for care in last 6 mos including higher income parents • 60% cut back on household expenses • 54% borrowed money/used credit cards • 34% modified child care to save money • 12% cut back on work hours • Income group reporting most difficulty – Title XX and just above
Child Care Subsidy Recipients • 48% having trouble paying for care • 26% behind on family share payments • 24% able to pay on their own regularly; 18% sometimes • 69% have borrowed money and/or used credit cards • 6% have used other options for care
Satisfaction with Child Care • Much higher than 2006 survey: • 90% satisfied or very satisfied • Changes in child care arrangements most common around school start/stop or change in parent’s work hours • When asked what they would change, 32% said cost of child care
Survey Conclusions • Location, location, location • Cost, cost, cost • Hours of care are key • Parents using all kinds of care combos • Parents are satisfied with their child care • Families at all income levels need more financial help – Title XX level in particular • Quality is not a priority in decision-making
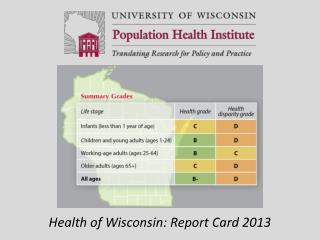
Westchester Supply • 80,000 slots needed for 160,700 birth to 12 • 32,000 slots = 40% of estimated demand • R&R callers – most can find care • High vacancies in existing programs “B” • Follow up – look at location and hours
Westchester Affordability • Mean costs tapered off but still high • Parents struggling to pay for care even at higher incomes • Less financial assistance for lower-income • Little to no assistance for middle-income “D-” • Follow up – education and advocacy
Westchester Quality • Few nationally accredited programs • High parent satisfaction per survey • Increased quality improvement activity • QUALITYstarsNY participation robust and growing “B” • Follow up – Expand QI activity, advocate for QSNY, educate parents on quality
Council Public Policy Agenda • Economic Impact and Benefits • Changing the perception – ROI, societal benefits • Affordability • Increase and manage public investment • Quality • Promote importance of quality • Fund and fully implement QSNY
Q and A Jeff Samuelson and Steve Wysmuller, CCCW Public Policy Committee • Reactions? • Questions? • Ideas?