Download
1 / 23
240 likes | 360 Views
Sequence alignment:. CLUSTALW. MUSCLE. Removing ambiguous positions:. T-COFFEE. FORBACK. Generation of pseudosamples:. SEQBOOT. PROTDIST. TREE-PUZZLE. Calculating and evaluating phylogenies:. PROTPARS. PHYML. NEIGHBOR. FITCH. SH-TEST in TREE-PUZZLE. CONSENSE.

E N D
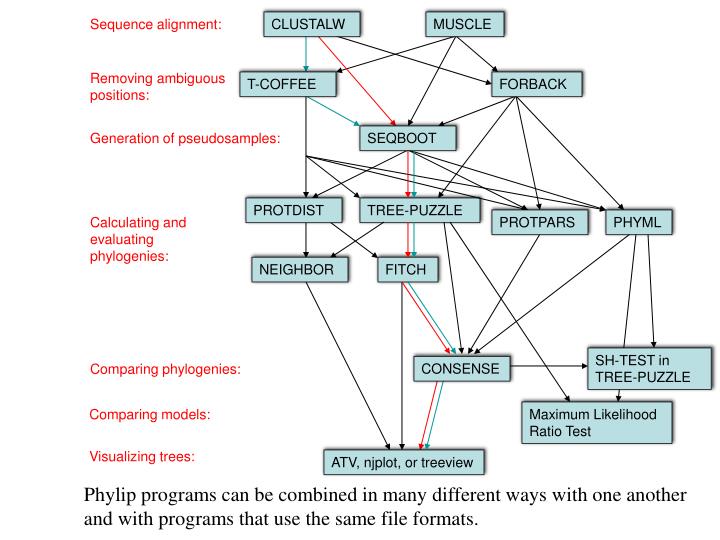
Sequence alignment: CLUSTALW MUSCLE Removing ambiguous positions: T-COFFEE FORBACK Generation of pseudosamples: SEQBOOT PROTDIST TREE-PUZZLE Calculating and evaluating phylogenies: PROTPARS PHYML NEIGHBOR FITCH SH-TEST in TREE-PUZZLE CONSENSE Comparing phylogenies: Comparing models: Maximum Likelihood Ratio Test Visualizing trees: ATV, njplot, or treeview Phylip programs can be combined in many different ways with one another and with programs that use the same file formats.
Example 1 Protpars example: seqboot, protpars, consense NOTE the bootstrap majority consensus tree does not necessarily have the same topology as the “best tree” from the original data! threshold parsimony, gap symbols - versus ? (in vi you could use :%s/-/?/g to replace all – ?) outfile outtree compare to distance matrix analysis
branches are scaled with respect to bootstrap support values, the number for the deepest branch is handeled incorrectly by njplot and treeview protpars (versus distance/FM) Extended majority rule consensus treeCONSENSUS TREE:the numbers on the branches indicate the numberof times the partition of the species into the two setswhich are separated by that branch occurredamong the trees, out of 100.00 trees +------Prochloroc +----------------------100.-| | +------Synechococ | | +--------------------Guillardia +-85.7-| | | | +-88.3-| +------Clostridiu | | | | +-100.-| | | | +-100.-| +------Thermoanae | +-50.8-| | | | +-------------Homo sapie +------| | | | | +------Oryza sati | | +---------------100.0-| | | +------Arabidopsi | | | | +--------------------Synechocys | | | | +---------------53.0-| +------Nostoc pun | | +-99.5-| | +-38.5-| +------Nostoc sp | | | +-------------Trichodesm | +------------------------------------------------Thermosyne remember: this is an unrooted tree!
what might be the explanation for the red algae not grouping with the plants? (protpars versus) distance/FM Tree is scaled with respect to the estimated number of substitutions.
protdist PROTdist Settings for this run: P Use JTT, PMB, PAM, Kimura, categories model? Jones-Taylor-Thornton matrix G Gamma distribution of rates among positions? No C One category of substitution rates? Yes W Use weights for positions? No M Analyze multiple data sets? No I Input sequences interleaved? Yes 0 Terminal type (IBM PC, ANSI)? ANSI 1 Print out the data at start of run No 2 Print indications of progress of run Yes
subtree with branch lengths without and with correction for ASRV
phyml PHYML - A simple, fast, and accurate algorithm to estimate large phylogenies by maximum likelihood An online interface is here ; there is a command line version that is described here (not as straight forward as in clustalw); a phylip like interface is automatically invoked, if you type “phyml” – the manual is here. Phyml is installed on bbcxsrv1. Do example on atp_all.phy Note data type, bootstrap option within program, models for ASRV (pinvar and gamma), by default the starting tree is calculated via neighbor joining.
phyml - comments Under some circumstances the consensus tree calculated by phyml is wrong. It is recommended to save all the individual trees and to also evaluate them with consense from the phylip package. Note: phyml allows longer names, but consense allows only 10 characters! phyml is fast enough to analyze dataset with hundreds of sequences (in 1990, a maximum likelihood analyses with 12 sequences (no ASRV) took several days). For moderately sized datasets you can estimate branch support through a bootstrap analysis (it still might run several hours, but compared to protml or PAUP, this is extremely fast). The paper describing phyml is here, a brief interview with the authors is here
LBA ProtPars
LBA Prot Dist with Gamma and alignment
LBA Prot Dist with Gamma and no alignment
LBA Prot Dist no Gamma and no alignment
Trees – what might they mean? Calculating a tree is comparatively easy, figuring out what it might mean is much more difficult. If this is the probable organismal tree: species A species B species C species D what could be the reason for obtaining this gene tree: seq. from A seq. from D seq. from C seq. from B
e.g., 60% bootstrap support for bipartition (AD)(CB) lack of resolution seq. from A seq. from D seq. from C seq. from B
the two longest branches join together e.g., 100% bootstrap support for bipartition (AD)(CB) long branch attraction artifact seq. from A seq. from D seq. from C seq. from B What could you do to investigate if this is a possible explanation? use only slow positions, use an algorithm that corrects for ASRV
Gene Transfer molecular tree: seq. from A seq. from D seq. from C seq. from B speciation genetransfer Gene transfer Organismal tree: species A species B species C species D
molecular tree: molecular tree: seq. from A seq. from A seq. from A seq. from B seq. from B seq. from C seq. from C seq. from D seq. from D seq. from D seq.’ from B seq.’ from B seq.’ from C seq.’ from C seq.’ from C gene duplication gene duplication gene duplication seq.’ from D seq.’ from D seq.’ from D Organismal tree: Gene duplication species A species B species C gene duplication species D molecular tree:
Gene duplication and gene transfer are equivalent explanations. The more relatives of C are found that do not have the blue type of gene, the less likely is the duplication loss scenario Ancient duplication followed by gene loss Horizontal or lateral Gene Note that scenario B involves many more individual events than A 1 HGT with orthologous replacement 1 gene duplication followed by 4 independent gene loss events
What is it good for? Gene duplication events can provide an outgroup that allows rooting a molecular phylogeny. Most famously this principle was applied in case of the tree of life – the only outgroup available in this case are ancient paralogs (see http://gogarten.uconn.edu/cvs/Publ_Pres.htm for more info). However, the same principle also is applicable to any group of organisms, where a duplication preceded the radiation (example). Lineage specific duplications also provide insights into which traits were important during evolution of a lineage.
Function, ortho- and paralogy molecular tree: seq. from A seq.’ from B seq.’fromC seq.’ from D gene duplication seq. from B seq. from C seq. from D The presence of the duplication is a taxonomic character (shared derived character in species B C D). The phylogeny suggests that seq’ and seq have similar function, and that this function was important in the evolution of the clade BCD. seq’ in B and seq’in C and D are orthologs and probably have the same function, whereas seq and seq’ in BCD probably have different function (the difference might be in subfunctionalization of functions that seq had in A. – e.g. organ specific expression)