Download

1 / 51
510 likes | 600 Views
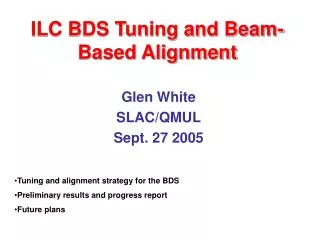
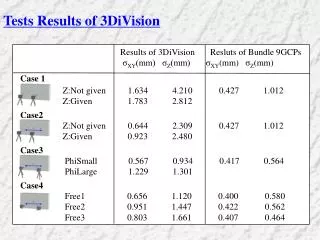
Latest results of our Beam-based alignment tests at FACET. Andrea Latina, f or the E-211 team: myself, Erik Adli , and Dario Pellegrini CLIC Beam Physics meeting, March 26 2014. A=Andrea ; D=Dario; Erik was also there. Main Goals. Study of Wakefield-Free Steering in sectors LI02 – LI04

E N D
Latest results of our Beam-based alignment tests at FACET Andrea Latina, for the E-211 team: myself, Erik Adli, and Dario Pellegrini CLIC Beam Physics meeting, March 26 2014
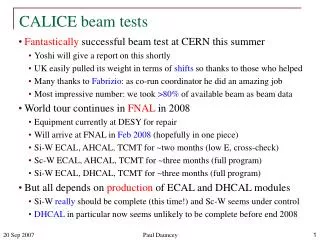
Main Goals • Study of Wakefield-Free Steeringin sectors LI02 – LI04 • Study of Wakefield-Free Steering and Dispersion-Free Steering simultaneouslyin sectors LI02 – LI04 • Apply WFS and DFS over longer sections of the LINAC sectors LI05-11 • Deploy a set of new tools:friendly, robust, flexible, complete, portable
The SLAC linac • Divided in 100m long sectors • Energy = from 1.19 GeV to 20.3 GeV • Bunch length = from 1.0-1.5 mm in S02 to 20 μm in S20 • Nominal charge = 2e10 e- (test charge = 1.3e10 e-) * * * * • (*) Emittace measurements: • S02: 7 wires (only 5 used) • S04: quad-scan (1 wire) • S11: 4 wires (only 3 used) • S18: quad-scan (1 wire) • Orbit feedbacks (slow): • S03-04, S06, S11, S15: orbit correction • S09, S17-18: energy correction
Recap of BBA: DFS and WFS • DFS: measure and correct the system response to a change in energy(we off-phased one klystron either in sectors S02 or in S04, depending on the case) • WFS: measure and correct the system response to a change in the bunch charge (this time we used 70% of the nominal charge, 2e10 e- and 1.3e10 e-) Recap of the equations woptimal= ~40 Simulation: DFS weight scan Simulation: WFS weight scan
Shift 1 – Monday – Sectors LI02-04 • Goals • Wake free steering (WFS) tests is Sectors 02-04: • Measure orbit response, R0 • Measure test-charge response, Rwake (we call it R2) • See the impact of WFS on the orbit and if possible on the emittance • Progress • Studied orbit difference for different charge variations • Studied orbit difference for different energy variations (offset phase of klystron LI02:21, by 45 degrees) • Measured R0 and R2 for S02 and S03 • Performed WFS for one parameter set: vertical wakefields seem reduced, results will be analyzed in more detail • Data: • We used 88 correctors • Same number of BPMS
Shift 1 – Monday – Sectors LI02-04 Vertical Wakefield orbit = Y_test_charge – Y_nominal <<< Steps of corection <<<
Shift 1 – Monday – Sectors LI02-04 Horizontal Wakefield orbit = X_test_charge – X_nominal <<< Steps of corection <<<
Sectors LI02-04Comparing the matrices afterthree months time
LI02-04 – Nov 13 vs. Mar 14Horizontal orbit response LHS = March 2014 ; RHS = November 2013;
LI02-04 – Nov 13 vs. Mar 14Vertical orbit response LHS = March 2014 ; RHS = November 2013;
Difference in LI02 – LI04from Nov 2013 to Mar 2014 Relative difference of the orbit responses from November 2013 to March 2014 • norm(Rx_nov - Rx_mar) / norm(Rx_mar) = 8.25 % • norm(Ry_nov – Ry_mar) / norm(Ry_mar) = 9.22 % Matrices look quite similar. Need to evaluate the impact of BPM noise w.r.t. machine drifts.
Shift 2– Thursday– Sectors LI02-04 • Goals • Wake free steering (WFS) tests is Sectors 02-04. • Based on the experience during Shift 1, the goals for Shift 2 are: • Test different parameters, and understand why we could correct in Y and not in X. Did nonlinearities play a role during Shift 1? • Plot the emittance vs the WFS weight, to locate the best working point [theoretical value is for w=40 (assuming ~3 micron BPM resolution)]
Shift 2 – Thursday – Sectors LI02-04 Convergence plot. Apply WFS with optimal weight=40. Emittance at start of our shift was: X = 2.79 / - Y = 0.54 / - Emittanceafter correction X = 3.38 / 1.01 Y = 0.12 / 1.16 ; 0.17 / 1.20
Shift 2 – Thursday – Sectors LI02-04 Weight scan vs. emittance. We tried w = 4, 40, 160, 400. • Vertical emittance measured in sector 04 (quad scan) • w = 0 initial vertical emittance: 0.56 / 1.10 • w = 4, vertical emittance = 0.36 / 1.63 • w = 40, vertical emittance = 0.12 / 1.16 (re-measured: 0.17 / 1.20) • w = 160, emittance not measurable • w = 400, emittance not measurable From simulation, one expects something like the black line in the plot: • Conclusion: • Emittance scan gives expected results • No time to measure more points
Shift 3 – Saturday – Sectors LI02-04 Goals 1) Apply simultaneous DFS+WFS Measure the response of dispersion in S02-S04 2) Optimize speed in measurements 3) Test a feed-forward system to stabilize the orbit during correction 4) Measure effectiveness of correction by looking at both orbit and emittance 5) Extend measurements of system to S05 and downstream Progress: • Achieved goal 1) • Achieved goal 2). With the help of Nate we improved the speed in both the measurements, and in the steering (Sectors 02 03 and 04 - speed up by 30%) • Achieved goal 3). An alternative stabilizing scheme was implemented an tested. The old feed-forward scheme could not be used, since LI06 orbit feedback was on during the measurements on Monday • Dispersion diverged during correction, to be understood why. • Goal 4) was not achieved • Goal 5) Not attempted
Shift 3 – Saturday – Sectors LI02-04 Measure the response of dispersion in S02-S04 Optimize speed in measurements Test a feed-forward system to stabilize the orbit during correction Measure effectiveness of correction by looking at both orbit and emittance Extend measurements of system to S05 and downstream Measured time to set corrector and read bpms Work with Nate Lipkowitz to speed up the overall procedures. Overall 30% speed upmeasured in acquiring the response. SPEED UP OK!
Shift 3 – Saturday – Sectors LI02-04 First test of combined DFS+WFS
Shift 3 – Saturday – Sectors LI02-04 Test of DFS alone: DFS LI02-LI04 gain = 0.5 svd = 0.7 w1_w0 = 40
Shift 4 – Sunday – Sectors LI05-11 • Goals • Measure orbit, dispersion and wake responses LI05-LI09 (bpms up to LI11) • Apply DFS + WFS in same sectors, fine tune feed-forward scheme • Measure effectiveness of correction by looking at both orbit and emittance • Progress • Achieved goal 1) • Achieved goal 2) • Goal 3). We verified that the algorithms perform as they should from the point of view of reducing the wake field orbit difference and the energy orbit difference. However, we did not manage to see significantly improved emittances in LI11 after correction.
Dispersion response: R1-R0 Wakefield response: R2-R0 X Y X Y
Shift 4 – Sunday – Sectors LI05-11 • Test of DFS+WFS followed by WFS only • Iteration 1-7 (including): DFS+WFS • corresponding to previous plot blow) • Iteration 8-10 (including): drift (gain=0) • corresponding to previous plot blow) • Iteration:11-18 (including): WFS (setting DFS gain to 0) • Iteration 13: some kind of machine hickup (not identified). Algorithm recovers afterwards • Emittance non measureable in Y – we stopped
Shift 4 – Sunday – Sectors LI05-11 • Problems: • Very unstable machine • Damping ring extraction kicker • NRTL energy jitter • Earthquake ?? • Initial config problems with scavenger line (3h to recover) • Emittance at start of our shift: • X = 4.6 (4.186 * 1.1) • Y = 0.47 (0.445 * 1.06) • Emittance before BBA (6h later) • X = 11.21 * 1.19 • Y = 0.91 * 1.12 • Emittance after correction: • X = 9.50/1.04 • Y = 1.06/2.40 • (improvement in X)
Trying to address the divergence Shift 4 – Sunday – Sectors LI05-11 Example of convergence Test of DFS+WFS: LI02-LI04 w1_w0 = 40 Shift 3 – Saturday – Sectors LI02-04 Example of divergence: Test of DFS alone: DFS LI02-LI04 gain = 0.5 svd = 0.7 w1_w0 = 40
Singular values for X and Y 2 very large singular values – we need to understand what they do represent
Correcting a simulated LINACwith the measured response matrices …including: • Injection jitter • Misalignments • BPM resolution error (3 microm) • Transverse and Longitudinal Wakefields Picking N progressive singular values at time
N=2 singular values norm_OrbitX = 8.13995 norm_OrbitY = 25.8351 norm_DispX = 1.29383 norm_DispY = 2.99051 norm_WakeX = 0.905165 norm_WakeY = 1.17392
N=3 singular values norm_OrbitX = 10.3687 norm_OrbitY = 22.6852 norm_DispX = 1.53973 norm_DispY = 3.02105 norm_WakeX = 0.729164 norm_WakeY = 0.998268
N=4 singular values norm_OrbitX = 7.61432 norm_OrbitY = 19.1609 norm_DispX = 1.03749 norm_DispY = 1.40887 norm_WakeX = 0.50546 norm_WakeY = 0.734156
N=5 singular values norm_OrbitX = 6.72384 norm_OrbitY = 22.656 norm_DispX = 0.811785 norm_DispY = 1.34545 norm_WakeX = 0.380037 norm_WakeY = 0.869225
N=6 singular values norm_OrbitX= 7.31326 norm_OrbitY= 23.0469 norm_DispX= 1.04246 norm_DispY= 1.38634 norm_WakeX= 0.435169 norm_WakeY= 0.917698
Shift 5 – Mon-Tue – Sectors LI05-11 • Goals • Based on the experience during our first four shifts, we want to apply simultaneous DFS WFS correction on the axes X and Y independently, using a (very) small number of singular values on each axis, while keeping the other axis hold on the golden orbit. • Test 1 • Keep X trajectory on the golden orbit • Correct Y axis with 4 different singular value cuts (tentatively: 1, 2, 4, 8 singular values) • Check convergence over 10 iterations • Test 2 • Keep Y trajectory on the golden orbit • Correct X axis with 4 different singular value cuts (tentatively: 1, 2, 4, 8 singular values) • Check convergence over 10 iteration • 3) Measure the emittance whenever the convergence looks promising.
Shift 5 – Mon-Tue – Sectors LI05-11 Progress • In Y: applied correction for singular values using up to 1,3,5,7,10 and 15 SVs - while holding X orbit constant with orbit correction • Result in Y: some emittance correction for 3,5 SV. Measurable but degraded emittance for 1,7,10 singular values. 10, 15 SVs included: indications of divergence • In X: applied correction for singular values 1,3,5 - while holding Y orbit constant with orbit correction • Result in X: more divergent than Y, and very poor emittances after correction • Speed: improvement in correction speed. Now less than 2 min per iteration.
Shift 5 – Mon-Tue – Sectors LI05-11 Extra test • I wanted to try the new tools that we have developed for BBA. • I tried a few interesting things: • simultaneous X and Y correction (after one shift focused on 1 axis at the time) • use of all coupled information • re-measurement of the golden orbit after 5 or 6 iterations, to update the reference for the orbit correction The emittance measurements from 4am to 5am witness the result: an improvement in both horizontal and vertical emittance, with quite satisfactory numbers in Y:--> from 1.58 was the last vertical emittance measured before correction • down to 0.50 after few iterations of fully coupled correction • to further 0.40 after resetting the target orbit during the correction(equivalent to correct without orbit constraint)
The new tools • object: Interface • FACET • PLACET • object: State • Complete machine information • Persistent • GUI: SysID • Excite correctors • Acquires orbits • Store state files • GUI: BBA • Acquires orbits • Computes and apply correction • Displays orbits / convergence • Stores everything on disk • Compute Response matrices • R0: orbit • R1: dispersion • R2: wakefiels
Some Conclusions • We learned that our matrices seem still valid after months • We see reasonable orbit / dispersion / wake control (many free parameters to tune, difficult to find the optimum) • We managed to measure improved emittance almost systematically • We still have a lot to learn from the data • We have developed some fantastic new tools
Additionally: new tools developed System Identification User Interface
Additionally: new tools developed Beam-Based Alignment User Interface (under development)
Response 1: X-excitations, absolute orbits (raw data) X axis [mm] Y-excitations Bpms X-excitations Excitation number From the Y-exctiations we can extract jitter in the X direction.
Response 1: Y-excitations, absolute orbits (raw data) Y axis [mm] Y-excitations X-excitations Bpms Excitation number BPM 46 seems faulted. From the X-excitations we can extract jitter in the Y direction.
Response 1:rms jitter vs max excitation Removed vertical BPM 46