Download
1 / 36
360 likes | 478 Views
Atmospheric GCM Response to Extratropical SST Anomalies: Synthesis and Evaluation Kushnir et al. (2002) (J. Climate). Motivation. Interactions between ET ocean and atmos. We saw how ENSO may help climate prediction We saw how ENSO and midlats may be linked

E N D
Atmospheric GCM Response to Extratropical SST Anomalies: Synthesis and EvaluationKushnir et al. (2002) (J. Climate)
Motivation • Interactions between ET ocean and atmos. • We saw how ENSO may help climate prediction • We saw how ENSO and midlats may be linked • How does atmos. respond to SST anomalies? • Feedbacks • Deep mixed layers linked with extratropical SST anomalies. Changes persist. Predictability? • Do ET ocean anomalies affect large scale?
Observed SST Anomalies • Large, basin scale size. Similar in scale to low-frequency atmospheric variability. • SSTA e-folding timescale 3-5 months. Reflect well-mixed upper-ocean layer heat content changes. • Monthly & seasonal ET SSTAs well correlated with surface air temp anomalies. • Dominant patterns of monthly & seasonal SSTAs well correlated with primary patterns of atm circ anomalies. Strongest during winter and when atm leads ocean by about a month.
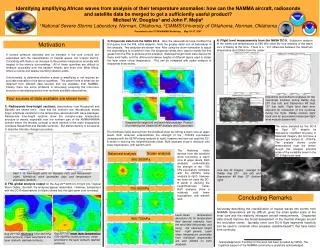
Observed SST Anomalies • Neg. ET SSTAs assoc. with stronger than normal westerlies above. Cyclone poleward and anticyclone equatorward. • Equivalent barotropic vertical structure for atmospheric anomalies during winter.
Vertical cross section along 52.5oN of Dec-Mar air temperature and geopotential height anomalies (linear regression) with the leading PC of NA SST.
Surface Flux Focing of SST Anomalies • Correlation between upward surface flux and SST is negative (Figure 1). • Changes in wind speed and advection (heat & moisture) anomalies in MBL both important (Seager et al. 2000). • Ekman and local sfc flux forcing often same order of magnitude and in phase (NA & NP). • 500 hPa hgt data and weekly SST data show atm leads ocean 2-3 weeks (Deser and Timlin 1997).
Fall Season Reemergence Of Winter-Forced SSTAs • Covered in Deser et al. (2002)
Atmospheric Response • Response to Reemergence & Persistence of Anomalies • Statistically signifiant covariance between 500-hPa hgts during winter and SST up to six months earlier. Atmospheric response shows NAO pattern (Czaja and Frankignoul). • Thermal inertial & reemergence (perhaps other factors)
SS95 = 0.5 SS95 = 0.25 • Autocorrelation fcn of first PC of monthly, year-round NA SSTAs, fcn of calendar month. • Cross correlation between first PC of monthly, year-round SLP, and first PC of monthly, year- • round North Atlantic SSTAs
Decadal Variability • Bjerknes (1964) - multiyear SSTAs in Gulf Stream extension region, distinct from interannual SST variability. • Decadal SST anomalies caused by an alteration in magnitude and location of wind-driven, sub-tropical gyre, a response to multiyear changes in basin-scale atm. circ. • More recent evidence - both Pacific (Zhang et al. 1997; Nakamura et al. 1997) and Atl (Deser and Blackmon 1993; Kushnir 1994). • El Nino related oceanic heat advection? Predictable form of atm-ocean interaction possible if atmosphere responds to SSTAs.
Tropical Vs. Midlat Forcing • SST anomalies in tropical Pacific produce global atmospheric teleconnection patterns. • Leads to more uncertainty in the interpretation of observational and modeling studies dealing with atmospheric-oceanic interactions.
Linear Response To Heating • Magnitude of dynamical atm response in midlats often measured as 500-hPa hgt response to a surface thermal anomaly. • Forced variability often smaller than unforced variability. • Obs stand. dev. of 500-hPa hgts on monthly to interannual timescales on order of 50 to 100-m. • Impermiability & Heating Responses. • Heating balanced by either zonal or meridional temperature advection, depending on depth of heating. • If deep heating, meridional adv dominates => downstream shift of low. • For shallow heating, both zonal and merdional adv important => baroclinic warm core system downstream
Linear Response Cont. • Vort equation determines the balance at upper levels. PV sink balanced by either zonal advection (=> low west of heating and high downwind) or meridional advection across the mean PV gradient (=> downstream low). For horizontal spatial scale of typical SST anomaly, zonal advection dominates, giving a downstream high. • Primitive Equations on Sphere (with varying basic states and complex heat sources) - solutions complex but consistent with QG framework (Hoskins & Karoly 1981; Hendon & Hartman 1982; Valdes and Hoskins 1989; Ting 1991; Ting and Peng 1995; Peng and Whitaker 1999). • GCM responses to ET SSTAs show greater sensitivity to underlying climatology than linear calculations and show equiv. barotropic response like obs (Hall et al 2001).
Response to (top) deep and (bottom) shallow heating of the linear QG model in a wide Beta channel with a westerly, baroclinic jet in its center.
Nonlinear Response • Nonlinearities in dynamics • e.g., transient eddies (often coming from quadratic nonlinearities in the equations of motion; i.e., advection; important in formation and maintenance of equilibrium response to an SSTA. • Can use transients from a GCM to force a linear model. Response to transient eddy vorticity flux can reverse linear, near-surface response to shallow heating! Depends on climatological flow. • Nonlinearities in physical parameterizations • e.g., bulk aerodynamic formula
GCM response to stationary and simplified SST anomalies • SST anomalies are simplified in detail or just the ET portion is kept. Prescribed SST anomalies are often amplified to get a detectable response pattern. • Climatological SST background restricted to single calendar month to reduce variability (keep solar zenith angle constant, land surface constant, etc) • Integrate for longer than a month to reach atm. equilibrium with ocean anomaly or shorter-term ensembles with same SSTA in calendar month. Compare to unforced runs or runs with opposite sign anomaly. • Diverse results (linear/nonlinear, baroclinic/equiv. barotropic)
1) Role of Background Climatology • Response depends on underlying model climate (given by SZA and unperturbed SST) (Peng et al 1995). • A realistic warm SSTA in western NA, different responses under Nov. and Jan. conditions. Cold SSTA no effect.Nov: downstream equiv. barot. highJan: weaker equiv. barot. low • Peng et al. (1997) NP warm anomaly. Weaker and much more zonal flow in Feb. than Jan. Jan has baroclinic response with shallow low and Feb has an equiv. barot. high.
2) Role Of Baroclinic Eddy Feedback • Linear response to midlat heating is baroclinic (largely insensitive to model details). • Small differences between responses in different basic states may amplify through interactions with transient eddy storm tracks. • Ting and Peng (1995) took transient eddy forcing terms from GCM experiments of Peng et al. (1995) and forced a linear model. Jet in November is more zonal than Jan => heating with same SSTA induces upper-level response that weakens jet in Nov. but strengthens it in Jan. • Peng and Whitaker (1999) considered Peng et al (1997) results for Pacific SSTAs. Take heating and transient forcing from GCM results and force linear, time-dependent, primitive equations.
Role of BaroclinicEddy Feedback • Take sum of GCM climatological flows for each month and a linear response to heating to create a new basic state. Put into a linear, QG storm-track model. Perturb with stochatic forcing to get baroclinic eddy statistics, with eddy vorticity fluxes that go with the given basic state. Then one can calculate geopotential height tendency. Use this tendency to force the linear, primitive equation model giving an anomalous flow driven by eddy momentum forcing. • See also Figure 5b. • Overall, eddy feedback depends on configurations of climatological storm track, SSTA, and relative positions.
Relationship to Intrinsic Model Variability • Peng & Robinson (2001) examine relationship between SST-forced response from Peng et al. (1997) and model's unperturbed internal variability. => SST-forced response has local and direct linear response to low-level heating and an eddy-driven component resembling model's internal variability (barotropic). • Internal variability differs month-to-month. Eddy-driven component is equiv. barotropic. For warm SSTAs over NP to induce equiv-barotropic high in center of basin, model's internal variability must have well-defined center of action there. PDFs of leading EOFs of monthly 500-hPa anomalies changes.
Response to time-varying SST variability in "realistic" integ. • Use history of SSTAs and compare with observations. • Studies use global SSTAs. As such, ET signal from ET anomalies mixed with response from tropical SSTAs. • Most studies neglect focus on mechanisms assoc. with response. Most work measures the degree of internal vs. SST-forced variability and characteristics of SST-forced variability.
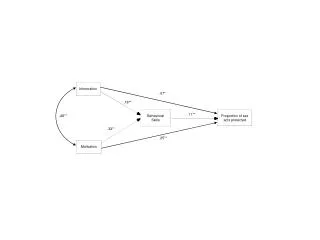
1) Relative importance of internal vs. forced vblty • Analysis of variance (or similar approaches) • Partition total variance into internal & SST-forced components • Potential predictability = (SST-forced var)/(Total Var) "Level of predictability that could be achieved given perfect knowledge of the boundary conditions." • Fig. 7 -tropical belt has high SST-forced variance (60-80%). Mid and High lats exemplify 20% Pot. Predictability.
2) Response to SSTAs • Construct composites based on some chosen SST indices (Refer to Figure 1). Use of SST index appropriate when we expect a response to a SSTAs and for high signal-to-noise ratios (extratropics are obscured) Therefore: • EOFs, singular value decompositions, and canonical correlation analysis. • Attemps at identifying SST-forced variability. • NP shows PNA-like responses to ENSO • NA Both ENSO and NA SST pattern (winter and spring). Perhaps the SSTAs force P.P. fluctuations in NAO index? • Increased variance (compared to climatological SSTs) with varying SSTAs (true for NAO). Probably mostly due to tropical SSTAs.
Coupled Model Studies of ET Interaction • Interaction often captured in coupled model setting. • Barsugli and Battisti (1998)
BB98 Review • Surface heat flux due to atmospheric vblty and atmospheric response to SST determine time evolution of SST. • BB98 linear model - SSTA tendency depends linearly on anomalous atm column mean temp. and SSTA.
BB98 Cont. • Allows for direct comparison of different types of GCM exp. coupled and uncoupled and assess the effect of thermal coupling on SST and atm. temperature vblty. • Coupling enhances variance and persistence of atm. and oceanic temps. • Air-sea coupling decreases surface heat flux between ocean and atm. In experiments with prescribed SSTAs, the heat flux at low freq. likely too large and of wrong sign. • Reduction in thermal damping exerted by ocean on atmosphere (ocean responds to changing atmosphere!)
BB98 Cont. • Bretherton and Battisti (2000) • Ensemble mean skill in reproducing the NAO vblty on interannual timescales when forced with a time history of observed SSTAs. BB98 model run in AMIP mode show same mean skill. But here, all vblty is driven by unpredictable atmospheric noise. In the mean a large ensemble of GCM runs forced with SSTAs, high-frequency vblty filtered out leaving low freq. atm response selecting weak influence of SST vblty common to all members of ensemble. No implied predictability • In coupled system, atmosphere continually forces SST, information is lost in the timescale of SSTA..
Coupled GCM Experiments • Compare atm. vblty of coupled midlat system with uncoupled vblty associated with climatological SST conditions. • All levels of sophistication point to coupling with midlat oceans increases the low-frequency atmospheric thermal variance and extends persistence of atm anomalies. • Results indicate coupling mostly due to thermodynamic effects (slab vs. full ocean models similar results) • Reduced thermal damping, coupling can increase persistence of atm. structures most sensitive to damping.
Conclusions • ET ocean influences atmosphere outside of MBL, but small amplitude compared to internal variability. • Vblty projects strongly on internal modes of vblty. Governed by interactions between transients and large-scale flow. Must investigate pdfs of internal modes.
Conclusions • A linear stochastic model explains much of the behoavior and predictability of the complex coupled ocean-atm system. Dominant influence of midlat ocean on the overlying atm is to reduce thermal damping of atmospheric low-frequncy vblty. • Future research - how relatively weak influence of ocean on atm, with strong atm influence on ocean, determines vblty of ET, coupled system. (transition seasons)