Download
1 / 59
600 likes | 736 Views
Beyond Surviving Optimizing Profitability. M&A Activity in Wholesale Distribution. * Excludes transactions in the retail consumer markets Source: Pembroke Consulting. Distribution Trends – EBITDA Multiples. 2007. 2005. 2006. 2004. Source: MDM, Vol38, No. 4, February 25, 2008.

E N D
Beyond Surviving Optimizing Profitability
M&A Activity in Wholesale Distribution * Excludes transactions in the retail consumer markets Source: Pembroke Consulting
Distribution Trends – EBITDA Multiples 2007 2005 2006 2004 Source: MDM, Vol38, No. 4, February 25, 2008
Top 10 Public Distribution Firms By ROIC% Source: MDM, Vol38, No. 4, February 25, 2008
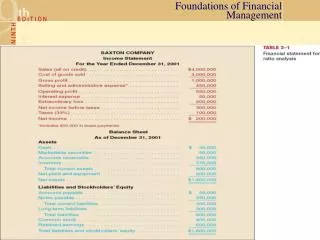
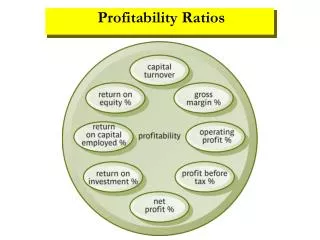
The ROI Equation Financial Statements “Balance Sheet” &“Income Statement” encapsulate the results of the above activities
Supply Chain Planning Key Performance Indicators (KPIs) Business Process Framework Supplier Customer
Best Practices Framework Best Practices Good Practices Performance Common Practices Time
Process Assessment Workbook – Applications • Workbook can be used to • Assess other branches / regions, hence set company-wide process benchmarking • Assess acquisition targets’ process potential • Custom report identifies process and financial gaps
Connecting Processes and Shareholder Value $hareholder Value
Implementation – Complexity vs. Decision-making • Low ROI • Low Level of Acceptance • High ROI Complex Models • High ROI • Need Training • Low ROI • Lack of Local Knowledge Simple Models Majority of distributors De-centralized Decision-Making Centralized Decision-Making Everything should be made as simple as possible, but not one bit simpler - Albert Einstein
Supply Chain Planning Support Services ODP Methodology IDENTIFY GAP MAP SHAREHOLDER VALUE ASSESS PROFITABILITY UNDERSTAND BEST PRACTICES ENABLE & IMPLEMENT Process Framework
Source – Supplier Management – Supplier Stratification Best Practices Good Practices • Loyalty, Profitability, Services, Performance • Risk/Exposure – supply availability, technical requirements, financial factors, technological factors and environmental issues • Landed Cost (TCO) • Combination Methodology • Segmentation based on COGS by supplier • Pareto framework (80%-20%) Performance Common Practices • Purchase price variance • Landed cost • Lacks segmentation framework Time
Supply Chain Planning Support Services ODP Methodology IDENTIFY GAP MAP SHAREHOLDER VALUE ASSESS PROFITABILITY UNDERSTAND BEST PRACTICES ENABLE & IMPLEMENT Process Framework
Linking SOURCE Processes to Shareholder Value Process Group Process Process Metric Financial Elements Financial Metrics
Supply Chain Planning Support Services ODP Methodology IDENTIFY GAP MAP SHAREHOLDER VALUE ASSESS PROFITABILITY UNDERSTAND BEST PRACTICES ENABLE & IMPLEMENT Process Framework
Source Analyzer – LT & LT Variability – Schematic Diagram Basic Input Parameters Additional Revenue EBITDA Lead Time LT Var Expected Turns P&L and Bal. Sheet Safety Stock % of re-investment RONA GMROII Turns YES Re-invest ? Average Inventory NO
Supply Chain Planning Support Services ODP Methodology IDENTIFY GAP MAP SHAREHOLDER VALUE ASSESS PROFITABILITY UNDERSTAND BEST PRACTICES ENABLE & IMPLEMENT Process Framework
Sell – Sales Management – Customer Stratification Best Practices Good Practices • Based on multiple factors – CTS, Business Potential, Relationship, Customer Lifetime Value, Net Profit, Loyalty • Combination methodology • Based on single factor – Sales, Gross Margin, Business Potential Performance Common Practices • No customer stratification • Customer groups based on – Market Type or Product Line • Top customers based on revenue Time
Sell – Pricing Management – Pricing Methods Best Practices Good Practices • Pricing Optimization • Pricing matrix based – Customer Stratification, Seller’s Item Visibility, Buyer’s Item Visibility and Cost Levels & Margin Levels • Pricing Rules / Heuristics • Value based pricing • Pricing matrix based on customer stratification and seller’s item visibility Performance Common Practices • Cost Plus Pricing • Cost Plus Driven Matrix Pricing • List Price or List-Less Pricing Time
SELL Real World Example