Download
1 / 4
40 likes | 168 Views
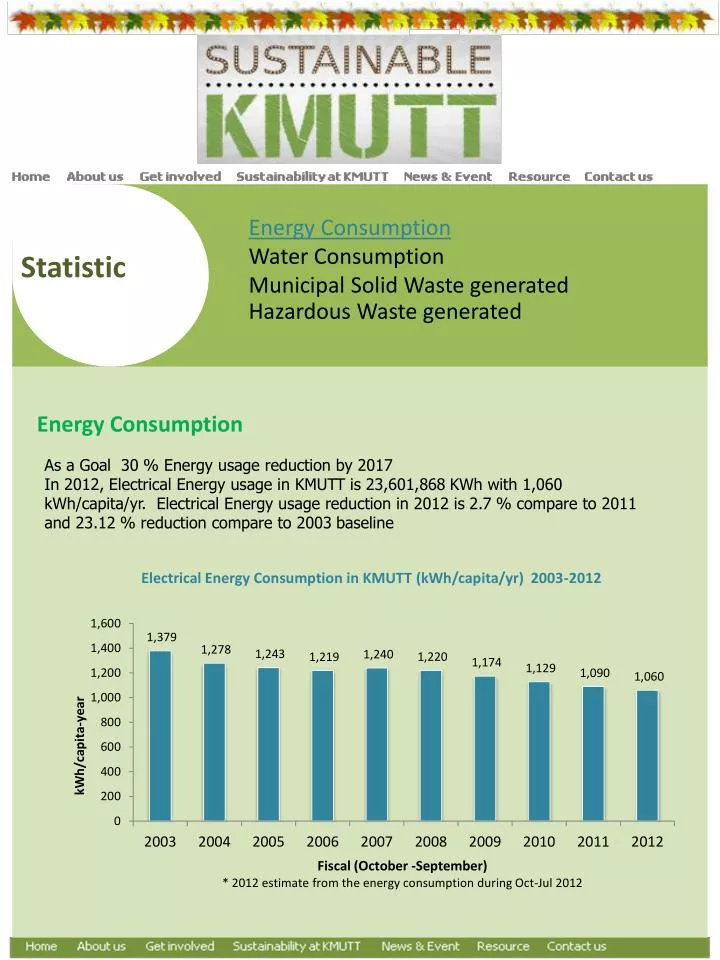
Energy Consumption Water Consumption Municipal Solid W aste generated Hazardous Waste generated. Statistic. Energy Consumption. As a Goal 30 % Energy usage reduction by 2017

E N D
Energy Consumption Water Consumption Municipal Solid Waste generated Hazardous Waste generated • Statistic Energy Consumption As a Goal 30 % Energy usage reduction by 2017 • In 2012, Electrical Energy usage in KMUTT is 23,601,868 KWh with 1,060 kWh/capita/yr. Electrical Energy usage reduction in 2012 is 2.7 % compare to 2011 and 23.12 % reduction compare to 2003 baseline Electrical Energy Consumption in KMUTT (kWh/capita/yr) 2003-2012
Energy Consumption Water Consumption Municipal Solid Waste generated Hazardous Waste generated • Statistic Water Consumption As a Goal : 45% of pipe water usage reduction by 2017 Pipe water usage in the year 2012= 293,964 cu.m(13.21cu.m/capita/yr) decreasing 4.49% from 2011 (decreasing 44.49 %compare to 2003 baseline) Water Consumption in KMUTT (cu.m/capita/yr) 2003-2012
Energy Consumption Water Consumption Municipal Solid Waste generated Hazardous Waste generated • Statistic Hazardous Waste generated In 2012 ,KMUTT produce hazardous waste in the total of 9,669 Kg. with 8,614 Kg of liquid waste, 858 Kg of Solid waste and 197 kg of special waste. KMUTT produce Hazardous waste 0.72 Kg/capita/yr. Hazardous Waste reduction in 2012 equal to 20 %compare to 2011and 62.69 % reduction compare to 2007 baseline Hazardous Waste generated (kg/capita/yr) 2003-2012 Fiscal (October -September) * 2012 estimate from the energy consumption during Oct-Jul 2012
Energy Consumption Water Consumption Municipal Solid Waste generated Hazardous Waste generated • Statistic Municipal Solid Waste generated In 2012, KMUTT generates municipal solid waste in the total of 537,528.7 kg, 24.15 kg/capita-year. Municipal solid waste reduces 32.6 % when compare year base 2006. Municipal solid waste recycles 18.08 % (paper 57%and plastic 25% and others 18%) Municipal Solid Waste generated (kg/capita/yr) 2006-2012 kg/capita-yr Fiscal (October -September) * 2012 estimate from the energy consumption during Oct-Jul 2012