Download
1 / 22
220 likes | 305 Views
Two-Sample Inference Procedures with Means.

E N D
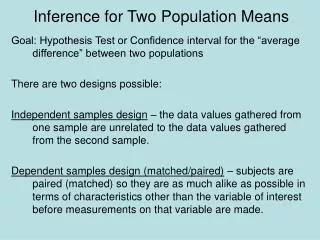
Suppose we have a population of adult men with a mean height of 71 inches and standard deviation of 2.6 inches. We also have a population of adult women with a mean height of 65 inches and standard deviation of 2.3 inches. Assume heights are normally distributed. Describe the distribution of the difference in heights between males and females (male-female). Normal distribution with mx-y =6 inches & sx-y =3.471 inches
Female Male 65 71 Difference = male - female 6
Remember: We will be interested in the difference of means, so we will use this to find standard error.
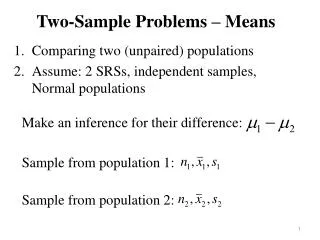
Two-Sample Procedures with means • The goal of these inference procedures is to compare the responses to two treatments or to compare the characteristics of two populations. • We have INDEPENDENT samples from each treatment or population
Assumptions: • Have two SRS’s from the populations or two randomly assigned treatment groups • Samples are independent • Both populations are normally distributed • Have large sample sizes • Graph BOTH sets of data • s’s known/unknown
Since in real-life, we will NOT know both s’s, we will do t-procedures. Formulas
Degrees of Freedom Option 1: use the smaller of the two values n1 – 1 and n2 – 1 This will produce conservative results – higher p-values & lower confidence. Option 2: approximation used by technology Calculator does this automatically!
Confidence intervals: Called standard error
Used for two populations with the same variance When you pool, you average the two-sample variances to estimate the common population variance. DO NOT use on AP Exam!!!!! Pooled procedures: We do NOT know the variances of the population, so ALWAYS tell the calculator NO for pooling!
Two competing headache remedies claim to give fast-acting relief. An experiment was performed to compare the mean lengths of time required for bodily absorption of brand A and brand B. Assume the absorption time is normally distributed. Twelve people were randomly selected and given an oral dosage of brand A. Another 12 were randomly selected and given an equal dosage of brand B. The length of time in minutes for the drugs to reach a specified level in the blood was recorded. The results follow: mean SD n Brand A 20.1 8.7 12 Brand B 18.9 7.5 12 Describe the shape & standard error for sampling distribution of the differences in the mean speed of absorption. (answer on next screen)
Describe the sampling distribution of the differences in the mean speed of absorption. Find a 95% confidence interval difference in mean lengths of time required for bodily absorption of each brand. (answer on next screen) Normal distribution with S.E. = 3.316
State assumptions! Think “Price is Right”! Closest without going over Assumptions: Have 2 independent SRS from volunteers Given the absorption rate is normally distributed s’s unknown Formula & calculations From calculator df = 21.53, use t* for df = 21 & 95% confidence level Conclusion in context We are 95% confident that the true difference in mean lengths of time required for bodily absorption of each brand is between –5.685 minutes and 8.085 minutes.
Note: confidence interval statements • Matched pairs – refer to “mean difference” • Two-Sample – refer to “difference of means”
In a recent study on biofeedback, it was reported that meditation could alter the alpha & beta waves in the brain thus changing the rate at which the heart beats. This is important for relieving the effects of stress. Let’s test this!
H0: m1 - m2 = 0 Ha: m1 - m2 < 0 Ha: m1 - m2 > 0 Ha: m1 - m2 ≠ 0 Hypothesis Statements: H0: m1 = m2 Be sure to define BOTHm1 and m2! Ha: m1< m2 Ha: m1> m2 Ha: m1 ≠ m2
Hypothesis Test: Since we usually assume H0 is true, then this equals 0 – so we can usually leave it out
The length of time in minutes for the drugs to reach a specified level in the blood was recorded. The results follow: mean SD n Brand A 20.1 8.7 12 Brand B 18.9 7.5 12 Is there sufficient evidence that these drugs differ in the speed at which they enter the blood stream?
H0: mA= mB Ha:mA= mB Assump.: Have 2 independent SRS from volunteers Given the absorption rate is normally distributed s’s unknown State assumptions! Hypotheses & define variables! Where mA is the true mean absorption time for Brand A & mB is the true mean absorption time for Brand B Formula & calculations Conclusion in context Since p-value > a, I fail to reject H0. There is not sufficient evidence to suggest that these drugs differ in the speed at which they enter the blood stream.
Suppose that the sample mean of Brand B is 16.5, then is Brand B faster? No, I would still fail to reject the null hypothesis.
Robustness: • Two-sample procedures are more robust than one-sample procedures • BEST to have equal sample sizes! (but not necessary)
Homework • MONDAY HOMEWORK • 11.37-11.39 all • 11.43, 44, 53, 54 – 66 even • Due Thursday 4/3 • Test Chapter 11 – Thursday 4/3