Download
1 / 62
620 likes | 708 Views
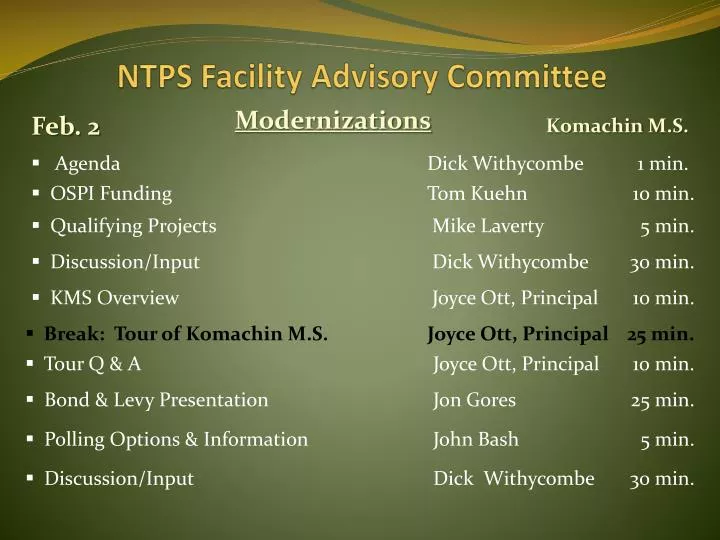
Modernizations. Feb. 2. NTPS Facility Advisory Committee. Komachin M.S. Modernizations. Feb. 2. NTPS Facility Advisory Committee. Komachin M.S. Modernizations. Feb. 2. NTPS Facility Advisory Committee. Komachin M.S. 2011-13 K-12 Capital Budget Governor’s Proposal.

E N D
Modernizations Feb. 2 NTPS Facility Advisory Committee Komachin M.S.
Modernizations Feb. 2 NTPS Facility Advisory Committee Komachin M.S.
Modernizations Feb. 2 NTPS Facility Advisory Committee Komachin M.S.
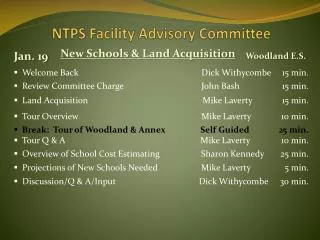
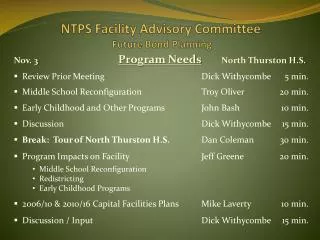
2011-13 K-12 Capital BudgetGovernor’s Proposal • Maintenance Level of $486.6 Million • Construction Cost Allocation inflationary increases to: FY 2012 = $183.78 FY 2013 = $188.55 • Small Repair grant program $10 Million • Skills Center Minor Works $3 Million • Aviation High School $2 Million
2011-13 K-12 Capital Budget State Bond Capacity The need to use the priority system is very likely.
Determining Eligibility For New Construction: = Projected Enrollment Space Allocation X Existing Inventory Un/Over Housed Regular ( 1049 ) E-90, M-117, H-130 Square footage from Study & Survey Eligibility for New Construction X = Handicapped ( 1066 ) Hdcp. -144 For Modernization or New-in-Lieu: Calculated SF Improved Space = Eligibility for Mod or N/L
Determining Eligibility for New Construction SQUARE FOOTAGE BASED ON STATE ALLOCATIONS AND CURRENT OCTOBER ENROLLMENT PROJECTIONS EXISTING SCHOOL DISTRICT SQUARE FOOTAGE “OVER-HOUSED” SCHOOL DISTRICT
Determining Eligibility for New Construction EXISTING SCHOOL DISTRICT SQUARE FOOTAGE SQUARE FOOTAGE BASED ON STATE ALLOCATIONS AND CURRENT OCTOBER ENROLLMENT PROJECTIONS “UN-HOUSED” SCHOOL DISTRICT
Square Foot Allocation Elementary K-6 90 SF per student Middle 7-8 117 SF per student High 9-12 130 SF per student Handicapped 144 SF per student
State Assisted Projects by Biennial Year – Improved Space (Report 1)
Students with Disabilities Form 1066
Projected Enrollment - 1049 + 57 7,755 Growing
Determining Eligibility For New Construction: = Projected Enrollment Space Allocation X Existing Inventory Un/Over Housed Regular ( 1049 ) E-90, M-117, H-130 Square footage from Study & Survey Eligibility for New Construction X = Handicapped ( 1066 ) Hdcp. -144 For Modernization or New-in-Lieu: Calculated SF Improved Space = Eligibility for Mod or N/L
Eligibility Calculation Spreadsheet NEW Eligible for New Construction MOD / NEW-IN-LIEU
Determining Eligibility For New Construction: = Projected Enrollment Space Allocation X Existing Inventory Un/Over Housed Regular ( 1049 ) E-90, M-117, H-130 Square footage from Study & Survey Eligibility for New Construction X = Handicapped ( 1066 ) Hdcp. -144 For Modernization or New-in-Lieu: Calculated SF Improved Space = Eligibility for Mod or N/L
NEW MOD / NEW-IN-LIEU Eligible for Mod or N/L
Modernizations Feb. 2 NTPS Facility Advisory Committee Komachin M.S.
Modernizations Feb. 2 NTPS Facility Advisory Committee Komachin M.S.
Modernizations Feb. 2 NTPS Facility Advisory Committee Komachin M.S.
Modernizations Feb. 2 NTPS Facility Advisory Committee Komachin M.S.
Modernizations Feb. 2 NTPS Facility Advisory Committee Komachin M.S.
North ThurstonPublic Schools No. 3 Bond Issue Planning February 2, 2011 Jon Gores Senior Vice President (206) 389-4043 jgores@dadco.com
M&O Levies: 179 passed and 3 failed Capital Projects Levies: 35 passed and 2 failed Transportation Levies: 5 passed and 0 failed Bond Authorizations: 10 passed and 9 failed 2010 Election Results Summary--Statewide
Voting Patterns Source: Washington State Secretary of States Office
Capital Financing Options Bonds Voted Non-voted Capital Projects Levy
Types of School District Bonds Voted- Unlimited Tax General Obligation Bonds (UTGO) Non-voted – Limited General Obligation Bonds (LGO) A. Voter approved bonds are (UTGO) repaid with property taxes approved with a 60% yes vote, 40% validation 5% Debt Capacity = $482,536,454–$141,010,609 (outstanding debt) = $341,525,845 B. Non-voted bonds are (LGO) repaid with existing revenue can’t be used for “new” construction 3/8 of 1% Debt Capacity = $36,190,234–$2,455,609 (outstanding debt) = $33,734,625 Capital Financing Options
Capital Financing Options • C. Capital Projects Levy • Requires simple majority vote • No debt limit • Limited to a period of two through six years • May be used to construct, modernize, remodel school facilities, technology and technology training, painting, equipment repair • Multiple capital levy ballot propositions for different purposes (e.g., technology and new roof) at same election are permissible Bonds are the primary method used by Washington school districts to finance large scale capital projects because: • cash is generated up front • payments can be spread over time, and • districts have some control over taxpayer impacts
Assumptions for Tax Rate Planning Interest Rates Bond Rating Assessed Value Bond Structure Financial Planning
Assumptions for Tax Rate Planning A. Interest Rates - Lower interest rates result in lower tax rates for bonds. - Interest rates are determined when bonds are actually sold. - Assumption: All issue current rates plus 1.50% (150 basis points) Financial Planning
B. Bond Ratings - A higher bond rating results in lower interest rates. - Assumption: Aa1(with State Guarantee) Aa2(District Rating) Financial Planning
Financial Planning B. Bond Ratings continued… • Options include: • District’s rating (Aa2) • State Guarantee (Aa1) • Assumption: Aa1 (State Guarantee) • Aa2 (District Rating) Debt Factors Economy The Rating Financial Performance Governmental Factors
Financial Planning C. Assessed Value
Financial Planning C. Assessed Value continued… North Thurston School District No. 3
Financial Planning Assessed Value continued… • Projected Assessed Value Growth • Final 2010: -1.36% • Final 2011: -7.0% growth • Projected 2012: 1% growth • Projected 2013: 2% growth • Projected 2014-2036: 3% annual growth • Higher assessed values will lower the District’s tax rates (but not the overall payment) • An individual’s taxes will be based on the assessed value for their property • New construction vs. increase in value of existing property
Financial Planning D. Bond Structure • State law gives Districts great flexibility in determining bond structures • Options: • Level Debt • Level Tax Rate • Stepped Level Tax Rate
Bond Structure – Summary Comparison Interest Rates: All issue current rates plus 1.50% (150 basis points) Bond Rating: Aa1 (State Guarantee) District Rating: Aa2 Assessed Value Growth: 2010: -1.36%; Final 2011: -7.0% growth; 2012: 1% growth; Projected 2013: 2% growth; Projected 2014-2036: 3% annual growth.