Download
1 / 43
430 likes | 536 Views
Macro-Economic Aspects of BALTIC Sea Rim Countries . Roshan Hemantha Alahendra Jukka Vakio Azeez Oladapo Olokunola. The Baltic Rim economies continue to expand at an impressive pace.

E N D
Macro-Economic Aspects of BALTIC Sea Rim Countries Roshan Hemantha Alahendra Jukka VakioAzeez Oladapo Olokunola
The Baltic Rim economies continue to expand at an impressive pace. • Economic progress coupled with large-scale migration in the wake of EU entry of most countries has resulted in a sharp drop in un-employment • there is even a risk that labour shortages could hamper growth notably in the Baltic countries in the years ahead. This development seemed improbable just a few years ago. But much indicates that demand in these countries will also start to subside, reducing growth to more sustainable levels. • The anticipated global downturn in 2007 will put more pressure on exports, and the ECB’s rate hikes have an immediate effect on the Baltic countries. Al-though interest rates are still low, these trends should curb the buoyant credit growth and probably also temper the explosive surge in house prices in the Baltic region.
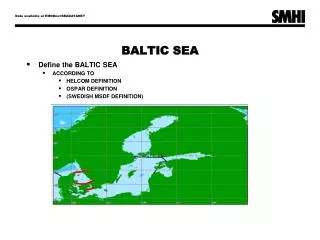
Estonia • Estonia is an upper middle-income country with a gross national income per capita of $9,100 in 2005 • A small country of about 1.35 million people, Estonia has few natural resources and is heavily reliant on trade, with telecoms being one of its main exports. • Its GDP has grown at an average of 7.5 percent since 2001.
Latvia is an upper middle-income country with a Gross National Income per capita of $6,750 in 2005 (GNI, Atlas method). More than one-third of a 2.3 million population is living in the capital city of Riga. Latvia has few natural resources and imports all of its natural gas and oil, as well as part of its electricity. The country is situated on vital east-west trade and energy transit routes. Forests cover almost 40 percent of the country's territory. Latvia
Lithuania is an upper middle-income country with a gross national income per capita of $7,210 in 2005 (GNI, Atlas method). Its population of 3.4 million enjoys high living standards and the health indicators of its citizens are significantly better than those of most other countries in the Europe and Central Asia Region. Lithuania acceded to the European Union on May 1, 2004 Lithuania
Poland • An upper middle-income country with a population of 38 million, Poland had a gross national income per capita of US$7,110 in 2005 (GNI, Atlas method). • Since 1989, the nation has undergone a remarkable political, social and economic transformation. • Achievements included uninterrupted economic growth averaging 5 percent per annum during the second half of the 1990s and accession to the European Union (EU) in May 2004
Russia • Russia is a middle income country with a population of approximately 143 million people and a gross national income per capita of $4460 in 2005 (GNI, Atlas method, WDI-2006).Russia is a collection of diverse territories at different stages of development. • Mainly because of high international oil prices, export revenue has soared since 2000. Import growth has picked up over the same period as a result of rising real incomes and real rouble appreciation. • The trade surplus climbed to US$118bn in 2005. The current-account surplus has been sizeable in recent years, exceeding US$84bn in 2005. The structure of exports is heavily dominated by fuels and raw materials.
Economic climate of the Nordic countries • The Nordic countries (Finland, Sweden, Denmark, Norway) are considered to be among the world’s wealthiest countries.The region is sophisticated, competitive and dynamic. It has a stable economic and political climate. • There are a lot of similarities in selling factors in all of the Nordic countries. Finland and Sweden are members of the European union, Norway is not an EU-member, however it is linked to the EU through the EEA agreement.
FINLAND • Finland has a highly industrialized economy. Finland’s GDP per capita is roughly the UK’s, France’s, Germany’s, and Italy’s output. • Two fifts of Finland’s GDP is consists of Exports. • Probably the biggest problem in Finland’s economy is high unemployment rate.
DENMARK • The Danish people enjoy living standards topped by no other nation, because of high GDP per capita, welfare benefits and political stability. • Denmark has decided not to join 12 other EU members in the euro, However the Danish krone has managed to keep a stable position to the Euro.
SWEDEN • Sweden has reached a high standard of living, helped by peace and neutrality through out the whole century. • Swedish voters turned down EMU in September 2003.
NORWAY • Norway is highly dependent on its oil production and international oil prices.Norway decided to stay out of the EU during a referendum in November 1994, however it contributes largely to the EU budget.
DEMOGRAHPHICS • Population 82,422,299 • Population growth rate -0.02% • Sex ratio 0.96 male M/F • Life expectancy at birth 78,8 years
FOREIGN TRADE • Exports $1,016trillion • Exports -machinery ,vechicles,chemicals,metals,and manufacturers,foodstuffs,textiles • Imports $801 billion • Imports -machinery and vechicles,chemicals,foodstuffs,textiles,metals • Current account balance $115,5billion
GERMANY EXPORTS • Exports: $1,016trillion
GERMANY IMPORTS • Imports:$801billion
GDP COMPOSITION • agriculture: 0.9% • industry: 29.6% • services: 69.5%
LABOUR FORCE • Labor force: 43.32 million • Labor force - by occupation:agriculture: 2.8% industry: 33.4% services: 63.8% • Unemployment rate:11,7%
GERMANY • Budget:revenues: $1.249 trillion expenditures: $1.362 trillion • Public debt: 67.3% of GDP
Sources www.statisk-bund.de www.oecd.com www.cia.gov/cia/pubilcations/factbook (http://www.bof.fi/bofin/gifs/bof_323_0i.gif) http://www.etla.fi/index.php?action=news&id=92 http://www.indexmundi.com/sweden/economy_overview.html Economics seventh edition; (Begg, Fischer 2003) http://www.indexmundi.com/norway/economy_overview.html http://www.export.gov/comm_svc/press_room/marketofthemonth/nordic/nordic.html International Monetary fund World bank Nordea Bank