Download
1 / 4
40 likes | 45 Views
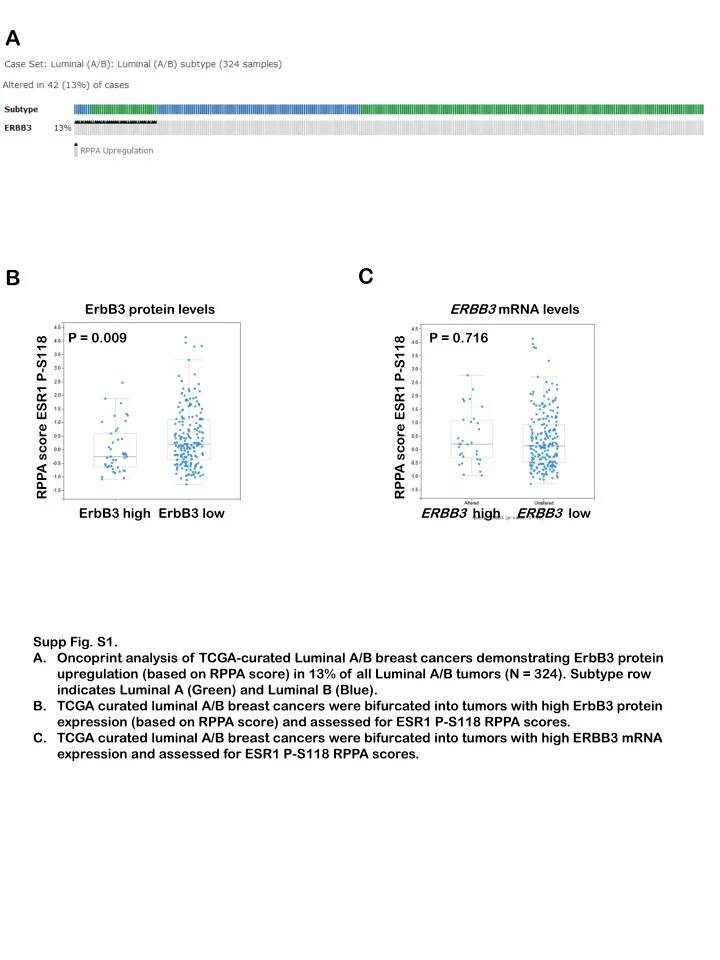
This study analyzes the ErbB3 protein levels and ERBB3 mRNA levels in luminal A/B breast cancers using TCGA-curated datasets. The results show upregulation of ErbB3 protein in 13% of luminal A/B tumors, and further assessment of ESR1 P-S118 RPPA scores was conducted based on ERBB3 mRNA expression. Additionally, the study evaluates the mRNA expression levels of NEDD4 and Nrdp1 and their impact on ErbB3 protein and ESR1 P-S118 RPPA scores.

E N D
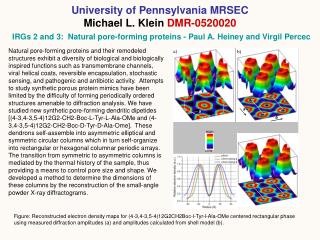
A C B ErbB3 protein levels ERBB3 mRNA levels P = 0.009 P = 0.716 RPPA score ESR1 P-S118 RPPA score ESR1 P-S118 ErbB3 high ErbB3 low ERBB3 high ERBB3 low • Supp Fig. S1. • Oncoprint analysis of TCGA-curated Luminal A/B breast cancers demonstrating ErbB3 protein upregulation (based on RPPA score) in 13% of all Luminal A/B tumors (N = 324). Subtype row indicates Luminal A (Green) and Luminal B (Blue). • TCGA curated luminal A/B breast cancers were bifurcated into tumors with high ErbB3 protein expression (based on RPPA score) and assessed for ESR1 P-S118 RPPA scores. • TCGA curated luminal A/B breast cancers were bifurcated into tumors with high ERBB3 mRNA expression and assessed for ESR1 P-S118 RPPA scores.
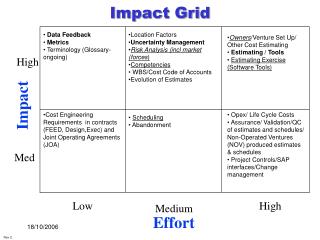
ErbB3 (RPPA score) NEDD4 high NEDD4 low Supp Fig. S2. TCGA curated luminal A/B breast cancers were bifurcated into tumors with high NEDD4 mRNA expression and assessed for ErbB3 RPPA scores.
Nrdp1 (201961_s_at) NEDD4 (213012_at) P = 0.87 P = 0.84 months months Supp Fig. S3. Transcript levels of Nrdp1 and NEDD4 were assessed in tamoxifen-treated breast cancer expression microarray datasets and used to generate a Kaplan-Meier survival curve using KmPlot.com. Analysis included all tumors treated with or without chemotherapy, and excluded all samples not treated with tamoxifen. The probes used for analysis are indicated at top of panel.
LRIG1 mRNA levels Nrdp1 mRNA levels NEDD4 mRNA levels P = 0.003 P = 0.490 P = 0.617 P-ESR1 S118 (RPPA score) P-ESR1 S118 (RPPA score) P-ESR1 S118 (RPPA score) LRIG1 high LRIG1 low Nrdp1 high Nrdp1 low NEDD4 high NEDD4 low Supp Fig. S4. Using TCGA-curated luminal breast cancer datasets, the RPPA protein score for ESR1 (ER) P-S118 was plotted for those tumors with high LRIG1, NRDP1, and NEDD4 mRNA expression as compared to the remaining luminal tumors. Midlines represent average, whiskers indicate S.D. Analysis was performed on cBioPortal.org.