Download
1 / 31
310 likes | 422 Views
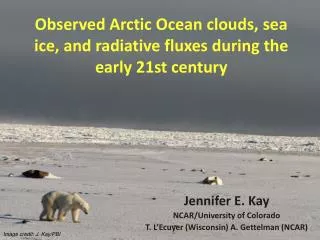
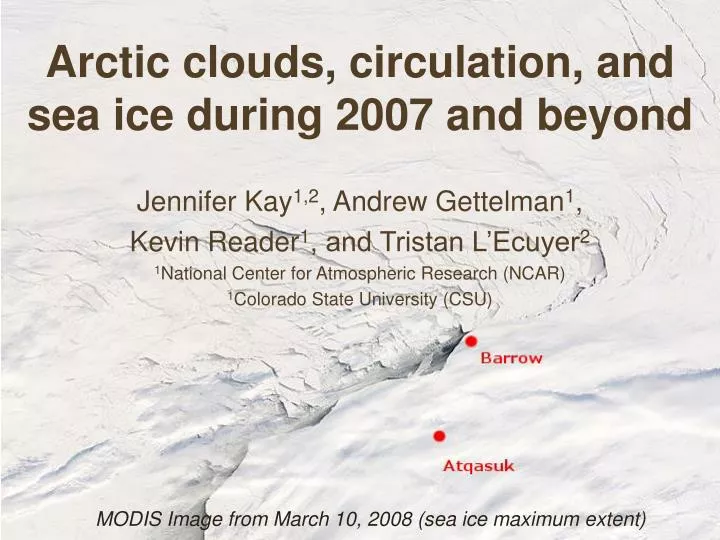
Arctic clouds, circulation, and sea ice during 2007 and beyond. Jennifer Kay 1,2 , Andrew Gettelman 1 , Kevin Reader 1 , and Tristan L’Ecuyer 2 1 National Center for Atmospheric Research (NCAR) 1 Colorado State University (CSU). MODIS Image from March 10, 2008 (sea ice maximum extent).

E N D
Arctic clouds, circulation, and sea ice during 2007 and beyond Jennifer Kay1,2, Andrew Gettelman1, Kevin Reader1, and Tristan L’Ecuyer2 1National Center for Atmospheric Research (NCAR) 1Colorado State University (CSU) MODIS Image from March 10, 2008 (sea ice maximum extent)
Lessons and questions from 2007 Data assimilation project (CAM-DART) Early observations for 2008 MODIS Image from March 26, 2008
Cloud and radiative flux differences(2007-2006) Radiative fluxes from 2B-FLXHR produced by Tristan L’Ecuyer (CSU).
In a warmer world with thinner ice, natural summertime circulation and cloud variability is an increasingly important control on sea ice extent.Kay, L’Ecuyer, Gettelman, Stephens, and O’Dell(Geophysical Research Letters, 2008)
Many remaining questions thermodynamic vs. dynamic loss processes cloud-ice-circulation feedbacks 3) year-to-year variability vs. long-term ice thinning 4) models: reliability?, what can they teach us? 5) tipping point? 2008?
Lessons and questions from 2007 Data assimilation project (CAM-DART) Early observations for 2008 MODIS Image from April 13, 2008
Why DART?DART = Data Assimilation Research Testbed Fig. 1 from Rodwell and Palmer (2007) • Science Questions • Do climate models capture observed changes in the atmospheric forcing on sea ice loss? • How does the Arctic ocean surface affect the Arctic atmosphere?
DART-CAM Assimilations • Science Questions For Today • How well do CAM/DART reanalyses capture observed changes? (July06 vs. July07) • Does the surface affect the best guess of the atmospheric state? (July07sst vs. July07clim)
July07 vs. Sept07 sea ice extent Source: NSIDC
Lessons and questions from 2007 Data assimilation project (CAM-DART) Early observations for 2008 MODIS Image from May 19, 2008
Summary • In a warmer world with thinner ice, the minimum sea ice extent is increasingly sensitive to year-to-year variability in weather and cloud patterns. • The timing of ice loss matters. • CAM-DART can qualitatively reproduce observed changes in the atmospheric forcing on sea ice. • 2008 atmospheric circulation and cloud anomalies are small. But… If the current anti-cyclonic pattern persists/strengthens, there will be significant sea ice loss in 2008.
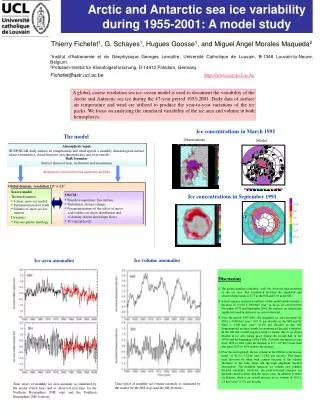
2007 Arctic sea ice extent Credit: NSIDC The sea ice extent at the 2007 minimum was 4.13 million km2 down 43% from 1979 and down 26% from the last record minimum in 2005.
DART-CAM noise slide PSL map fc_time=0,3,6 hours
2007 Western Arctic cloud reductions CloudSat/CALIOP data revealed reduced cloudiness and enhanced downwelling shortwave radiation (+32 Wm-2).