Download
1 / 1
10 likes | 217 Views
Arctic and Antarctic sea ice variability during 1955-2001: A model study. Thierry Fichefet 1 , G. Schayes 1 , Hugues Goosse 1 , and Miguel Angel Morales Maqueda 2 1 Institut d’Astronomie et de Géophysique Georges Lemaître, Université Catholique de Louvain, B-1348 Louvain-la-Neuve, Belgium.

E N D
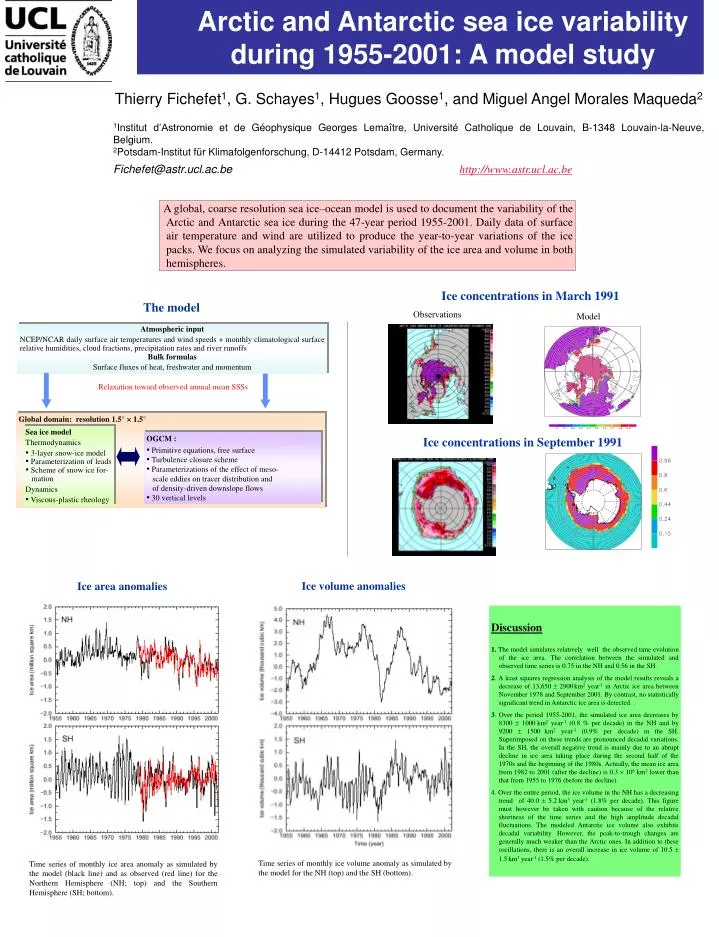
Arctic and Antarctic sea ice variability during 1955-2001: A model study Thierry Fichefet1, G. Schayes1, Hugues Goosse1, and Miguel Angel Morales Maqueda2 1Institut d’Astronomie et de Géophysique Georges Lemaître, Université Catholique de Louvain, B-1348 Louvain-la-Neuve, Belgium. 2Potsdam-Institut für Klimafolgenforschung, D-14412 Potsdam, Germany. Fichefet@astr.ucl.ac.be http://www.astr.ucl.ac.be A global, coarse resolution sea ice–ocean model is used to document the variability of the Arctic and Antarctic sea ice during the 47-year period 1955-2001. Daily data of surface air temperature and wind are utilized to produce the year-to-year variations of the ice packs. We focus on analyzing the simulated variability of the ice area and volume in both hemispheres. Ice concentrations in March 1991 Themodel Observations Model Atmospheric input NCEP/NCAR daily surface air temperatures and wind speeds + monthly climatological surface relative humidities, cloud fractions, precipitation rates and river runoffs Bulk formulas Surface fluxes of heat, freshwater and momentum Relaxation toward observed annual mean SSSs Global domain: resolution 1.5° 1.5° • Sea ice model • Thermodynamics • 3-layer snow-ice model • Parameterization of leads • Scheme of snow ice for- • mation • Dynamics • Viscous-plastic rheology • OGCM : • Primitive equations, free surface • Turbulence closure scheme • Parameterizations of the effect of meso- • scale eddies on tracer distribution and • of density-driven downslope flows • 30 vertical levels Ice concentrations in September 1991 Ice volume anomalies Ice area anomalies Discussion 1. The model simulates relatively well the observed time evolution of the ice area. The correlation between the simulated and observed time series is 0.75 in the NH and 0.56 in the SH. 2. A least squares regression analysis of the model results reveals a decrease of 13,650 2900km2 year-1 in Arctic ice area between November 1978 and September 2001. By contrast, no statistically significant trend in Antarctic ice area is detected. . 3. Over the period 1955-2001, the simulated ice area decreases by 8300 1000km2 year-1 (0.8 % per decade) in the NH and by 9200 1500km2 year-1 (0.9% per decade) in the SH. Superimposed on these trends are pronounced decadal variations. In the SH, the overall negative trend is mainly due to an abrupt decline in ice area taking place during the second half of the 1970s and the beginning of the 1980s. Actually, the mean ice area from 1982 to 2001 (after the decline) is 0.3 106 km2 lower than that from 1955 to 1976 (before the decline). 4. Over the entire period, the ice volume in the NH has a decreasing trend of 40.0 5.2km3 year-1 (1.8% per decade). This figure must however be taken with caution because of the relative shortness of the time series and the high amplitude decadal fluctuations. The modeled Antarctic ice volume also exhibits decadal variability. However, the peak-to-trough changes are generally much weaker than the Arctic ones. In addition to these oscillations, there is an overall increase in ice volume of 10.5 1.5km3 year-1 (1.5% per decade). Time series of monthly ice volume anomaly as simulated by the model for the NH (top) and the SH (bottom). Time series of monthly ice area anomaly as simulated by the model (black line) and as observed (red line) for the Northern Hemisphere (NH; top) and the Southern Hemisphere (SH; bottom).