Download
1 / 18
230 likes | 751 Views
Thinning Arctic Sea Ice. The Arctic. “Arctic ocean basin” Mediterranean ocean Lowest measured temperature: -68C The most humid place on Earth (=>feels colder than it is) 9 to 12 (16) million sq. km. What is sea ice?. Sea ice iceberg

E N D
The Arctic • “Arctic ocean basin” • Mediterranean ocean • Lowest measured temperature: -68C • The most humid place on Earth (=>feels colder than it is) • 9 to 12 (16) million sq. km
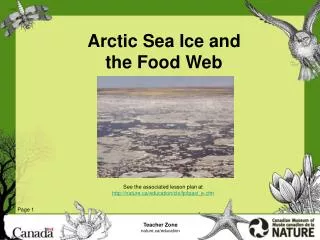
What is sea ice? • Sea ice iceberg • Boundary layer between “warm” ocean and cold atmosphere in the polar region • Brine rejection • Can float and accumulate • First year ice floe • Ridges • Multi-year ice
Sea ice cycle formation growth deformation disintegration Adapted from Canadian ice service site
Measuring ice decrease Here, satellite picture of Greenland’s retreating ice cover serves as an example of using satellite images to measure ice cover from space 1973 Landsat 1 image 2000 Landsat 7 image About 1440-meter retreat
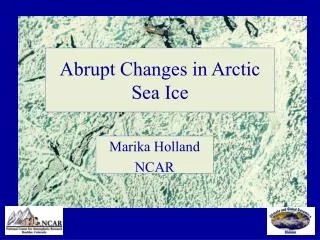
“Thinning of the Arctic Sea-Ice Cover”by D.A. Rothrock, Y. Yu, and G.A. Maykut, GRL 1999 • Comparison of data from 1958-1976 to data from 1990s • Submarine data • Draft measurements : about 1.3m decrease (40%), decrease continues at the rate of 0.1 m/year • Problems with comparison
“The arctic ice thickness anomaly of the 1990s: A consistent view from observations and models” by D.A. Rothrock, J. Zhang, and Y. Yu in JGR 2003 • Model and observations demonstrate “compelling agreement” • Model-observation disagreement in interannual variability • Current and future situation vs. current data • Better error characterization needed for more meaningful comparisons also incorporating the latest data from satellites
Consequences of Sea ice melting • Negative effects on arctic animals • Weather change in Canada: Gulf of St. Lawrence beaches exposed to winter storm waves • Increasing coastal erosion • Shipping and oil drilling safer
Sea-ice and global warming http://www.gfdl.gov/~kd/KDwebpages/NHice.html#three
Arctic ice and global warming • Positive feedback with ice melting (ice reflects 80% of the sunrays that reach it) • Sea-ice melting => global warming OR global warming => sea-ice melting??? • Arctic region: amplification of global warming effect • Sea-ice melting: not a contributor to the sea level rise (the melting glaciers are)