Download
1 / 49
490 likes | 506 Views
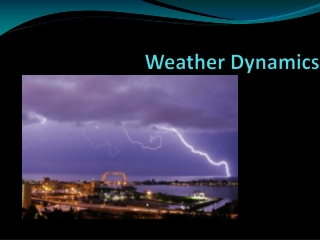
Weather system dynamics. Michael Revell NIWA m.revell@niwa.co.nz. Introduction. What are the main weather related hazards in New Zealand? What are the weather systems that produce these hazards? What drives them? What is their structure? Where and when are they most likely to occur?

E N D
Weather system dynamics Michael Revell NIWA m.revell@niwa.co.nz
Introduction • What are the main weather related hazards in New Zealand? • What are the weather systems that produce these hazards? • What drives them? • What is their structure? • Where and when are they most likely to occur? • Can we predict them? • How should we respond? – Your job!
Introduction • What are the main weather related hazards in New Zealand?
Weather hazards • Floods • Severe winds • Hail • Frosts • Snow • Ice • Lightning
Flood Flood Wind Wind Tornado Snow
Weather hazards (cont) • Can you think of any others? • Coastal waves – inundation / erosion • Subject of other workshops • Today focus on first 3 • Floods • Severe winds • Hail • Relative costs?
Insurance industry payouts as a function of hazard typeBetween 1968 and 1997 (Total = 1.05 Billion) • E – Bay of Plenty earthquake (1987) • F1 – Invercargill floods (1984) • F2 – Cyclone Bola (1988) • F3 – Otago floods (1978) • F4 – Wellington floods (1976) • W1 – Wahine (Ship) (1968) • W2 – Canterbury wind storm (1976) • W3 – Wahine (Storm) (1968) • H – Hastings hail storm (1994) • S – Canterbury snow storm (1992) • F - Queenstown 58m – 1999 • F - Manawatu >300m? – 2004 • F - BoP ~50m? - 2004
Weather systems • What are the weather systems that produce these hazards?
Weather systems that cause these hazards • Tropical cyclones – rain/wind • Subtropical cyclones – rain/wind • Midlatitude cyclones – wind/rain/snow • Fronts – wind/rain/hail/snow • Thunderstorms – rain/hail/wind • Tornadoes - wind
Why does understanding how weather systems work help you? • Know which weather systems produce which hazards • Know where in the systems the various hazards occur • Know what the precursors for the various hazards are • Know how predictable various hazards are
Tropical cyclone (Erica) rain / wind
Subtropical cyclonerain/wind Front wind/rain/hail/snow Mid/high latitude cyclone wind/rain/snow
What drives these weather systems? Motion ultimately driven by the sun • It heats the equator more than the pole • due to its spherical shape
2. It heats the surface more than upper levels • due to the fact that short wave radiation is mostly absorbed at surface
Net effect is the equator and the surface keep getting hotter • Weather is the atmosphere trying to restore thermodynamic equilibrium. • It tries to do this in the most efficient way • Tropics dominated by overturning • Reducing vertical temperature gradient • Higher latitudes by sloping convection • Reducing horizontal temperature gradient • Hazards occur when we put ourselves or structures in the way.
Consider each weather system type in turn • What is their structure? • Where and when are they most likely to occur? • Can we predict them?
Tropical Cyclones • Usually referred to as hurricanes, typhoons and cyclones in other parts of the world—are intense cyclonic storms of tropical origin. Surface winds can reach over 200 km/hour, and almost as if to accentuate this violence their central region or eye, of 20 to 50 km width, is calm and often completely clear. Luckily for us, there is no evidence of a tropical cyclone ever having reached New Zealand. As a tropical cyclone moves southward towards us, it encounters strong vertical shear in the wind such as upper jet streams. Coupled with the drop in sea temperature, this increasing background wind shear destroys the mechanism that maintains a tropical cyclone, and so it undergoes a transformation into a mid-latitude or ex-tropical cyclone. It is worth noting, however, that the “baggage” left over from the tropical cyclone, such as the residual clockwise circulation and very moist air it contains, mean that these ex-tropical cyclones can become some of the most devastating mid-latitude storms that New Zealand will experience. Examples are tropical cyclone Gisele that reformed to become the April 1968 Wahine storm and ex-tropical cyclone Bola that washed away huge amounts of topsoil in the Gisborne region in March 1988 and caused $90M damage.
500 km 15 km Idealised flow in a hurricane seen as a dissected section
All TCs, 1970-97 ET (S of 35°S), 1970-97 Highest fraction in March Tropical cyclones (when) • 81 out of 251 TC’s made it S of 35°S
TC track density, 70-97 Tropical cyclones (where) Contours are numbers per annum of TCs passing within 555 km of each location
TC average intensity, 1-4, 70-97 Tropical cyclones (cont)
Average Feb 200 mb flow (every 5 m/s) Shear and SST (SH)
NH Sept 200mb Flow Sept SST oC
Extratropical transformation • Process whereby a TC transforms from a hurricane to an extratropical cyclone • Hurricane structure • Warm core, symmetric, anticyclonic outflow aloft, convergent cyclonic flow beneath, symmetric ascent pattern • Mid-latitude cyclone • Asymmetric thermal and ascent fields, baroclinic structure with fronts • e.g. TC Gisele and the Wahine storm - 1968
Predictability? • Central core dynamics occur on scales of a few km • Most global NWP models don’t resolve them • Models resolve the large scale environment but initiation rather random • Can predict areas in which they are likely but generally not the individual events • Models do better as they move past the transition stage to higher latitudes
Mid-high latitude cyclones Sometimes referred to as depressions or lows - usually form within the belt of westerly winds encircling the globe between 30° and 70° S. They generally move from west to east, bringing a period of unsettled weather, with wind, cloud and precipitation, most noticeably at fronts. Mid-latitude cyclones are energized by sizeable contrasts in temperature with latitude that are caused by solar heating imbalances. The warm air flows southward and upward ahead of (east of) the low and the cold air flows northward and downward behind (west of) the cyclone centre. In addition most of the cloud and precipitation occurs in the rising warm air ahead of the cyclone, in contrast to the symmetric rainband of the tropical cyclone.
Structure Merging Warm air 1 km 5 km Cold air 1 km Cold air 3 km 5 km 1 km 3 km Currents in an active midlatitude cyclone as seen from above by an observer moving with the centre (heavier stippling denotes cloud)
When and where • These systems occur all year round • Generally between 30 and 70 S • Strongest winds and vertical motion associated with fronts
Predictability? • Most global models resolve their initiation and development well out to 3-5 days • The limiting factors are • Model error (model physics inaccurate) • Errors in specification of starting fields • Weather prediction inherently chaotic (little errors grow into big errors) • Ensemble methods are being used to help problems 2 and 3 above
Sub-tropical cyclone Darwin 15/00 1004.3 15/12 1001.9 16/00 1000.7 Mt Isa 16/12 998.7 17/00 997.5 17/12 996.1 Charleville 18/00 994.6 18/12 992.2 Alice Springs 19/00 987.5 19/12 985.5 Cobar 20/00 985.5 20/12 988.4 Sydney
When and where • These systems occur all year round • Generally between 20 and 30 S • Weak temperature contrast across the storm • Large vertical motion and associated latent heat release which can lead to rapid deepening on small scales
Predictability? • The faster growth rate on smaller scales due to moist processes amplifies any model or initial specification error • These systems tend not to be predicted consistently as well as higher latitude systems • There are exceptions like the weather ‘bomb’ which was forecast well 3 days ahead
Fronts:What are they?Useful concept? Cold Flow Flow Warm
Cause • Fronts form as a natural consequence of cyclone development where existing temperature gradients are concentrated by shear or confluence • Just as cyclones can be viewed as the consequence of instability of the Hadley circulation • Fronts can be viewed as an instability of the cyclone circulation
Description • The frontogenesis process can lead to very strong circulations with intense shear across the front and vertical motion • Depending on the temperature this vertical motion will produce rain or snow
When and where • Fronts occur all year round • Anytime cyclogenesis is occurring • Where temperature gradients are being increased by shear or confluence • Strongest winds and vertical motion (hence rain) associated with fronts (in midlatitudes)
Predictability? • The large scale aspects of fronts are predicted as well as the cyclones themselves (since they are a consequence of former) • Most NWP models resolve them • However the finer scale detail in the fronts (The rain bands and embedded thunderstorms) • Are not resolved by most models and are not so well predicted e.g. Weather Bomb. • Again ensemble methods are being used to help overcome these
Cause • Strong heating below (summertime) • Cold advection above (wintertime) • Creating very unstable conditions and extreme vertical motions ~ 30ms-1
Predictability • Occur on scales of a few km • Most NWP models don’t resolve them • Models resolve the large scale environment but initiation rather random • Can predict areas in which they are likely but generally not the individual events