Download
1 / 23
280 likes | 332 Views
System Dynamics. Modeling with STELLA software. Learning objective. After this class the students should be able to: Understand basic concepts of system dynamics, Stock Variable; Flow Variable; Information Flow; Material Flow; and Time Delay;

E N D
System Dynamics Modeling with STELLA software
Learning objective • After this class the students should be able to: • Understand basic concepts of system dynamics, • Stock Variable; • Flow Variable; • Information Flow; • Material Flow; and • Time Delay; • Understand how these basics elements interact with policies and decisions to determine the behavior of dynamic systems.
Time Management • The expected time to deliver this module is 50 minutes. 20 minutes are reserved for team practices and exercises and 30 minutes for lecture.
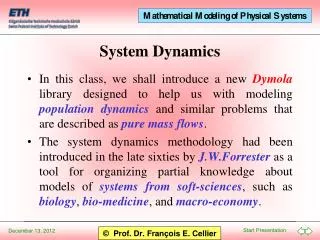
System Dynamics • Methodology to study systems behavior • It is used to show how the interaction between structures of the systems and their policies determine the system behavior • Approach developed to study system behaviors taking into account complex structures of feedbacks and time delays
Warm-up • Each team is invited to describe through any kind of diagram the process to fill a cup of water. • Imagine this as an exercise of operation management • (5 minutes)
Y X Z Feedback Loop • Feedback refers to the situation of X affecting Y and Y in turn affecting X perhaps through a chain of causes and effects.
Time Delay X Y Time Delay \It’s the time between the action and the result (consequence) of this action.
Desired Water Level Faucet Position Perceived Gap Water Flow Current Water Level Causal Diagram
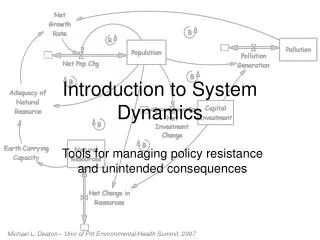
Population Dynamic feedbacks and time delays BirthsPopulation Deaths + + - +
Basic Elements • This methodology use five basics elements: • Stock Variable; • Flow Variable; • Information Flow; • Material Flow; and • Time Delay
Material Flow Activity Stock Information Flow Converter Object Oriented Language
Control Material Flaw to Stock Control Material Flaw from Stock Stock Send information from the Stock Add New information A Model
Exploring a simple example • To explore modeling with STELLA, we will develop interactively with you, a basic model of the dynamics of a fish population. • Assume you are the owner of a pond thatis stocked with 200 fish that all reproduce at a fixed rate of 5% per year. • For simplicity, assume also that none of the fish die. How many fish will youown after 20 years?
Stock - Fish Inventory • We begin with the first tool, a stock (rectangle). In our example model, the stock will represent the number of fish in our pond. Click here to open the stella software Figure 1 This stock is known as a reservoir. In our model, this stock represents the number of fish we have in this time are in our the pond
What control the number of fish • As we assumed that the fish in our pond never die, we have one control variable: REPRODUCTION. 200 Fishes Figure 2 • We use the flow tool (the right‑pointing arrow, second from the left) to represent the control variable, so named because it controls the states (variables).
Converter • Next we need to know how the fish in our population reproduce, that is, how to accurately estimate the number of new fish per annum. Remember? We assumed our fish population reproduce at 5% per year. • This can be represented as a transforming variable. A transforming variable is expressed as a converter, the circle that is second from the right in the STELLA toolbox.
Connector • At the right of the STELLA, toolbox is the connector (information arrow). We use the connector to pass on information about the REPRODUCTION RATE to REPRODUCTION and another to pass on information from FISH population to REPRODUCTION. Figure 3
Our first model • Once you draw the information arrow from the transforming variable REPRODUCTION RATE to the control and from the stock FISH to the control, open the control (REPRODUCTION) and converter (REPRODUCTION RATE) and type respectively 5/100 and the equation: REPRODUCTION RATE* FISH 5/100 200 REPRODUCTION RATE*FISH Figure 4
Run the model • We get Figure 5. We see a graph of exponential growth of the fish population in your pond. Figure 5
What-if? • From now on, the professor can practice “what-if” with the teams For example: • What would happen if we decided to extract fish at a constant rate of 3% per year, and the reproduction rate varied with the fish population as it is seen in figure 6? Figure 6
Results Figure 7
Reference • The Fifth Discipline. Peter Senge, Currency Doubleday, 1994, Chapter 5. • Modeling Dynamic Economic System. Ruth, M. & Hannon, B. Springer, 1997, Chapter 1