Download
1 / 8
1.04k likes | 7.13k Views
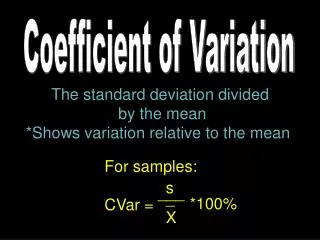
The Coefficient of Determination. The coefficient of determination, r 2 , is the ratio of explained variation in y to the total variation in y .

E N D
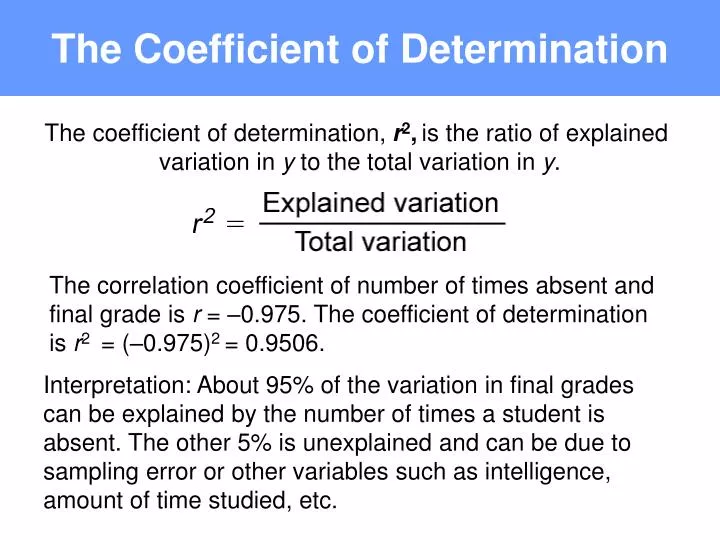
The Coefficient of Determination The coefficient of determination, r2,is the ratio of explained variation in y to the total variation in y. The correlation coefficient of number of times absent and final grade is r = –0.975. The coefficient of determination is r2 = (–0.975)2 = 0.9506. Interpretation: About 95% of the variation in final grades can be explained by the number of times a student is absent. The other 5% is unexplained and can be due to sampling error or other variables such as intelligence, amount of time studied, etc.
The Standard Error of Estimate The Standard Error of Estimate,se,is the standard deviation of the observed yi values about the predicted value.
The Standard Error of Estimate x y 1 8 78 74.275 13.8756 2 2 92 97.819 33.8608 3 5 90 86.047 15.6262 4 12 58 58.579 0.3352 5 15 43 46.807 14.4932 6 9 74 70.351 13.3152 7 6 81 82.123 1.2611 92.767 Calculate for each x. = 4.307
Prediction Intervals Given a specific linear regression equation and x0, a specific value of x, a c-prediction interval for y is: where The point estimate is andEis the maximum error of estimate. Use a t-distribution with n – 2 degrees of freedom.
Application Construct a 90% confidence interval for a final grade when a student has been absent 6 times. 1. Find the point estimate: The point (6, 82.123) is the point on the regression line with x-coordinate of 6.
Application Construct a 90% confidence interval for a final grade when a student has been absent 6 times. 2. Find E, At the 90% level of confidence, the maximum error of estimate is 9.438.
Application Construct a 90% confidence interval for a final grade when a student has been absent 6 times. 3. Find the endpoints. – E = 82.123 – 9.438 = 72.685 + E = 82.123 + 9.438 = 91.561 72.685 < y < 91.561 When x = 6, the 90% confidence interval is from 72.685 to 91.586.
Minitab Output Regression Analysis The regression equation is y = 106 – 3.92x Predictor Coef StDev T P Constant 105.668 3.655 28.91 0.000 x –3.9241 0.4019 –9.76 0.000 S = 4.307 R-Sq = 95.0% R-Sq(adj) = 94.0%