Download
1 / 24
260 likes | 460 Views
Measures of Variation. Section 3-3. Objectives. Describe data using measures of variation, such as range, variance, and standard deviation. Example: You own a bank and wish to determine which customer waiting line system is best. Branch A (Single Waiting Line).

E N D
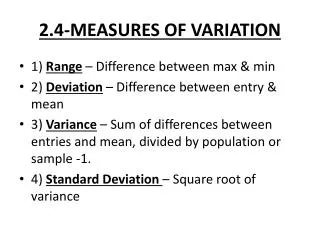
Measures of Variation Section 3-3
Objectives • Describe data using measures of variation, such as range, variance, and standard deviation
Example: You own a bank and wish to determine which customer waiting line system is best Branch A (Single Waiting Line) Branch B (Multiple Waiting Lines) (in minutes) 6.5 6.6 6.7 6.8 7.1 7.3 7.4 7.7 7.7 7.7 (in minutes) 4.2 5.4 5.8 6.2 6.7 7.7 7.7 8.5 9.3 10.0 Find the measures of central tendency and compare the two customer waiting line systems. Which is best?
Which is best –Branch A or Branch B? Does this information help us to decide which is best? Let’s take a look at the distributions of each branch’s wait times
Insights • Since measures of central tendency are equal, one might conclude that neither customer waiting line system is better. • But, if examined graphically, a somewhat different conclusion might be drawn. The waiting times for customers at Branch B (multiple lines) vary much more than those at Branch A (single line).
Measures of Variation • Range • Variance • Standard Deviation
Range • Range is the simplest of the three measures • Range is the highest value (maximum) minus the lowest value (minimum) • Denoted by R R = maximum – minimum • Not as useful as other two measures since it only depends on maximum and minimum
Example: You own a bank and wish to determine which customer waiting line system is best Branch A (Single Waiting Line) Branch B (Multiple Waiting Lines) (in minutes) 6.5 6.6 6.7 6.8 7.1 7.3 7.4 7.7 7.7 7.7 (in minutes) 4.2 5.4 5.8 6.2 6.7 7.7 7.7 8.5 9.3 10.0 Find the range for each branch
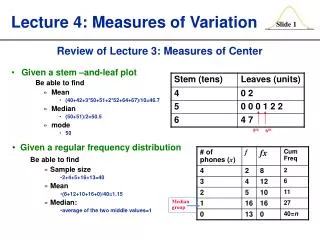
Variance & Standard Deviation Calculation Procedure • STEP 1: Find the mean for the data set • STEP 2: Subtract the mean from each data value (this helps us see how much “deviation” each data value has from the mean) • STEP 3: Square each resultfrom step 2 (Guarantees a positive value for the amount of “deviation” or distance from the mean) • STEP4: Find the sum of the squares from step 3 • STEP 5: Divide the sum by N or (n-1), the sample size (If you stop at this step, you have found the variance) • STEP 6: Take square root of value from step 5 (This gives you the standard deviation)
Measures of Variation Variance Standard Deviation Variance is the average of the squares of the distance each value is from the mean. Variance is an “unbiased estimator” (the variance for a sample tends to target the variance for a population instead of systematically under/over estimating the population variance) Serious disadvantage: the units of variance are different from the units of the raw data (variance = units squared or (units)2 Standard Deviation is the square root of the variance Standard Deviation is usually positive Standard deviation units are the same as the units of the raw data
Notations Variance Standard Deviation Population variance, s2 (lowercase Greek sigma) Sample variance, s2 Population standard deviation, s Sample standard deviation, s
NO WORRIES!!! • Since the formulas are so involved, we will use our calculators or MINITAB to determine the variance or standard deviation and focus our attention on the interpretation of the variance or standard deviation • Why did I bother showing you? So you have some sense of what is going on behind the scenes and realize it is not magic, it’s MATH
Uses of the Variance and Standard Deviation • Variances and standard deviations are used to determine the spread of the data. • If the variance or standard deviation is large, the data is more dispersed. This information is useful in comparing two or more data sets to determine which is more (most) variable • The measures of variance and standard deviation are used to determine the consistency of a variable • For example, in manufacturing of fittings, such as nuts and bolts, the variation in the diameters must be small, or the parts will not fit together
Uses of the Variance and Standard Deviation • The variance and standard deviation are used to determine the number of data values that fall within a specified interval in a distribution • For example, Chebyshev’s theorem shows that, for any distribution, at least 75% of the data values will fall within 2 standard deviations of the mean • The variance and standard deviation are used quite often in inferential statistics
Example: You own a bank and wish to determine which customer waiting line system is best Branch A (Single Waiting Line) Branch B (Multiple Waiting Lines) (in minutes) 6.5 6.6 6.7 6.8 7.1 7.3 7.4 7.7 7.7 7.7 (in minutes) 4.2 5.4 5.8 6.2 6.7 7.7 7.7 8.5 9.3 10.0 Find the standard deviation for each branch
Which is best –Branch A or Branch B? Does this information help us to decide which is best?
In a hurry? • If you are in a hurry and do not have a calculator to assist with the calculation of the standard deviation, we can use the Range Rule Of Thumb (RROT) • RROT • This is ONLY an estimate, but it is in the ballpark
RROT • RROT can also be used to estimate the maximum and minimum values of a data set. • Minimum “usual” value = • Maximum “usual” value =
Chebyshev’s Theorem (p.126) • Specifies the proportions of the spread in terms of the standard deviation • Applies to ANY distribution • The proportion of data values from a data set that will fall with k standard deviations of the mean will be AT LEAST
Empirical (Normal) Rule • Only applies to bell-shaped (normal) symmetric distributions
Examples • Page 129 #8 (Calculator) • Page 129 #10 (MINITAB)
Assignment • Page 129 #7-13 odd