Download

1 / 20
200 likes | 321 Views
Placement Variations and their Diagnosis. Waltenegus Dargie TU Dresden Chair of Computer Networks. Outline . Motivation Features Measurements Concluding remarks . Motivation. Use of sensors in mobile environments Healthcare

E N D
Placement Variations and their Diagnosis Waltenegus Dargie TU Dresden Chair of Computer Networks
Outline • Motivation • Features • Measurements • Concluding remarks
Motivation • Use of sensors in mobile environments • Healthcare • Activity monitoring (patients, nurses, elderly people, children) • Supply chain • Transportation
Motivation • The effect of sensor placement on the quality of sensed data • The acceleration of human movements varies from part to part of human body. • Acceleration in vertical direction and horizontal direction increase in magnitude from cranial (skull) to caudal (tail or posterior part of the body) body parts (Bao and Intille, 2004; Bouten et al., 2002)
Motivation • Not only the acceleration component of whole body, but also the partial acceleration component should be considered; for example, for hopping, measurements values from ankle are higher than value from thigh in magnitude and the measurements from arm and thigh are different. • On the other hand, sensors do not stay on their original place of deployment or might have not been deployed at “the right place” in the first place.
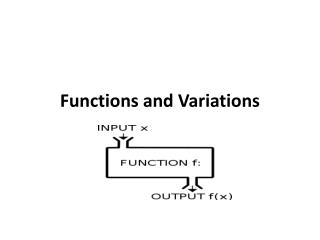
Features • For orientation error, the simple solution is to use the absolute acceleration
Features Mean-value crossing rate Correlation coefficients Auto/Cross correlation
Measurements • Sampling rate: 100 Hz • Frame length: 1.5s • Frame overlap: 25% • 6 Placements: thigh-thigh, thigh-knee, thigh-calf, thigh-ankle, thigh-arm, thigh-waist; • 4 Orientations: 0, 30, 45 and 85 • 840 pairs of data sets with total 960s length experiments readings for each movements
Conclusion • Calibration error has little impact on the quality of features • No one feature is robust against placement variations for all types of movements • Fortunately, the movement types which are distinct acceleration intervals can be detected despite placement and orientation variations.