Download
1 / 45
450 likes | 607 Views
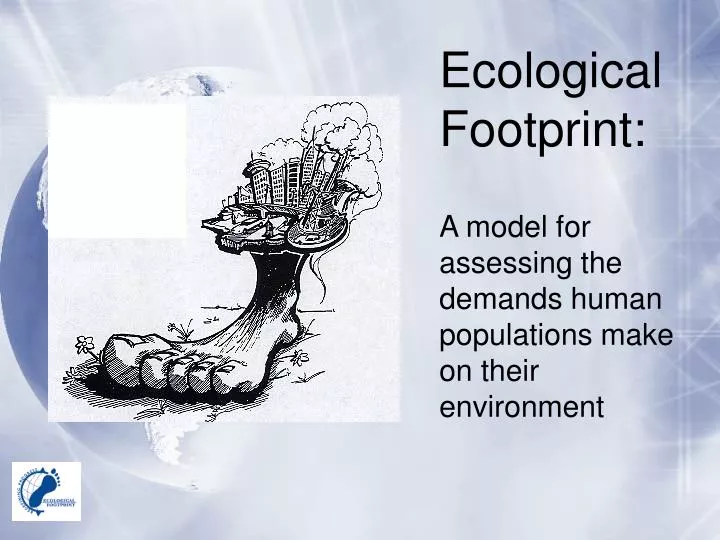
Ecological Footprint: A model for assessing the demands human populations make on their environment. Definition. An area of land required to support a defined human population at a given standard of living.

E N D
Ecological Footprint: A model for assessing the demands human populations make on their environment
Definition An area of land required to support a defined human population at a given standard of living. The measure takes account of the area required to sustainably provide all the resources needed by the population and assimilate all its wastes. -IBO
Ecological Footprint continued • What resources are provided by the Earth that are used by humans? Brainstorm a list.. • What wastes from humans must be assimilated? Make a list.
Ecological Footprint measures the area of land needed to.. • Provide food, housing land, energy needs, building materials, clothes, and other resource needs • It also includes land to recycle all wastes, including carbon dioxide from the burning of fossil fuels. (Remember photosynthesis: plants take in carbon dioxide.)
Use the next four slides to compare the footprints .. • Compare the composition of the world ecological footprint to lower, middle and higher income countries. • Write the differences and similarities in your notebooks.
Compare the ecological footprints for energy consumption in LEDC’s vs MEDC’s. Compare the ecological footprints for agriculture in LEDC’s vs MEDC’s.
Use the next slide to determine the largest and smallest ecological footprints per region.
The Asia Pacific region has the largest regional footprint. Even though the per capita impact of its consumption and technology is relatively small, the population is very large.
Before clicking on the next slide, suggest which region will have the highest and lowest per capita ecological footprints. Outline a reason for your answer.
Because of large consumption rates and advanced technology, industrial regions, such as the USA, create large per capita foot prints, even though they have small populations.
The next slide gives a good visualization of the sizes of ecological footprints worldwide.
The following slide puts the data all together. Summarize the next graph!
The following three slides compare the land areas used for food production. Suggest reasons that the USA always has the highest values for food production.
Ecological Footprints also include land needed to grow forests for building materials, furniture, and energy resources.
Energy footprint = the area of land area needed to produce resources and absorb wastes. This includes carbon dioxide waste produced by the burning of fossil fuels. Suggest countries which have the biggest energy footprints before viewing the next slide.
Here are lists ranking the countries with the highest and lowest ecological footprints.
The problem is when humanity’s ecological footprint exceeds the Earth’s biocapacity. The use of resources is unsustainable if the ecological footprint exceeds the biocapacity. Some scientists believe that this has already occurred.
Humanity’s Ecological Footprint exceeded the World’s Biocapacity in the 1970’s
Some people have become aware of the rate of resource use and are working to reduce wastes and consumption, especially in Europe.
Use the next slides to compare different ways to grow and distribute something as simple as a potato. Compare the energy required in each case. Outline reasons that some food production methods are more sustainable than others, using the potato as an example.
CONVENTIONAL POTATO Suppliers Producer Processing Plant Distribution Center Grocery Store
CONVENTIONAL POTATO Fossil Fuels Fossil Fuels Fertilizers Suppliers Machinery Pesticides Irrigation Truck Fossil Fuels Seeds Producer Irrigation Machinery Fossil Fuels Truck Fossil Fuels Hydropower Processing Plant Hydroelectric dam Machinery Hydropower Food waste Fossil Fuels Truck Fossil Fuels Freezer Distribution Center Animal Feed Hydroflourocarbons Truck Fossil Fuels Freezer Grocery Store Packaging
CONVENTIONAL POTATO Air Pollution Fossil Fuels Fossil Fuels Runoff Fertilizers Suppliers Machinery Loss of Biodiversity Pesticides Irrigation Truck Fossil Fuels Loss of Biodiversity Seeds Producer Irrigation Machinery Air Pollution Fossil Fuels Air Pollution Truck Fossil Fuels Hydropower Processing Plant Hydroelectric dam Machinery Loss of Biodiversity Hydropower Food waste Fossil Fuels Truck Fossil Fuels Freezer Distribution Center Animal Feed Damage To Ozone Hydroflourocarbons Truck Fossil Fuels Solid Waste Freezer Grocery Store Packaging
Forests CONVENTIONAL POTATO Forests With Sources and Sinks Air Pollution Fossil Fuels Fossil Fuels Runoff Fertilizers Suppliers River Machinery Loss of Biodiversity River Pesticides Irrigation Truck Fossil Fuels Loss of Biodiversity Seeds Producer Cropland Irrigation Machinery Air Pollution Fossil Fuels Air Pollution Truck Fossil Fuels Hydropower Forests Forests Processing Plant Hydroelectric dam Machinery Loss of Biodiversity Hydropower Food waste Fossil Fuels Truck Fossil Fuels Built-up Land Freezer Distribution Center Grazing Land Animal Feed Damage To Ozone Hydroflourocarbons Truck Fossil Fuels Solid Waste Freezer Grocery Store Packaging Forests Built-up Land Built-up Land
Sustainability: “To meet the needs of the current generations without compromising the ability of future generations to meet their own needs.” -UN World Commission on Environment and Development