Download
1 / 49
500 likes | 607 Views
Introduction to GIS. Map Projections. Surprise! It’s not a perfect sphere Earth is an… Oblate spheroid Oblate ellipsoid Geoidal. Earth’s shape. Geographic Coordinate System (GCS). An unprojected coordinate system

E N D
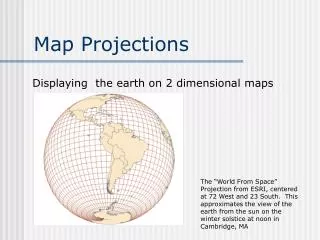
Introduction to GIS Map Projections
Surprise! It’s not a perfect sphere • Earth is an… • Oblate spheroid • Oblate ellipsoid • Geoidal Earth’s shape
An unprojected coordinate system • uses latitude and longitude to define the locations of points on a sphere or spheroid • Covers entire earth with one system and a single origin • Used when a single coordinate system is needed for entire earth • Since latitude and longitude are angular measurements they are not suitable for measuring distances. GCS
LATITUDE • the equator is the origin for latitude • 1 degree of latitude is ALWAYS 69 miles (111km) • LONGITUDE • Greenwich, England, is the origin for longitude. • 1 degree of longitude is 69 miles (111km) at the equator • 1 degree of longitude is 0 miles at the poles • ORIGIN • single origin is off the coast of Africa GCS
Latitude and longitude are angles expressed in degrees, minutes, and seconds • 1 degree = 60 minutes • 1 minute = 60 seconds • 125°30’ 45’’ • = 125 + 30/60 + 45/60/60 • = 125.5125 It’s about the angles
A datum is a mathematical representation (model, a set of reference points) of the shape of the Earth’s surface • It serves as the reference or base for calculating the Geographic Coordinate of a location. Datum for GCS http://gis.washington.edu/esrm250/lessons/projection/
Two kinds of datum: • A global/geocentric datum: is centered on the earth's center of mass. • World Geodetic System of 1984 (WGS 84). • A local datum: is slightly offset to a convenient location in order to accommodate a particular region of study. • The North American Datum of 1927 (NAD27) • The North American Datum of 1983 (NAD83) Datum for GCS
North American Datum of 1927 (NAD27) is a datum based on the Clarke ellipsoid of 1866. The reference or base station is located at Meades Ranch in Kansas. There are over 50,000 surveying monuments throughout the US and these have served as starting points for more local surveying and mapping efforts. Use of this datum is gradually being replaced by the North American Datum of 1983. • North American Datum of 1983 (NAD83) is an earth-centered datum based on the Geodetic Reference System of 1980. The size and shape of the earth was determined through measurements made by satellites and other sophisticated electronic equipment; the measurements accurately represent the earth to within two meters. North American Datums
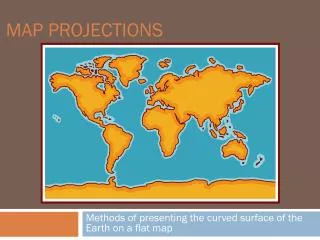
Projection is the process that transforms three-dimensional space onto a two-dimensional map. Projections
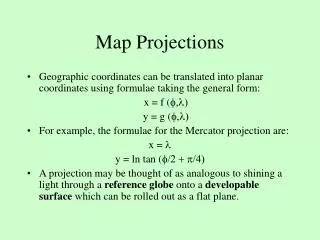
a Map Projection • this is what gets us flat • Scale change • zoom into the area of interest • Map Coordinates • this helps us locate things on the map Map Projections
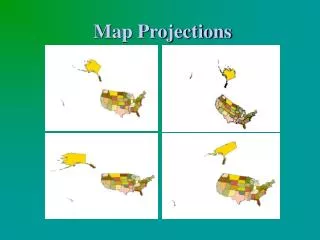
ANY projected flat map distorts reality by compromising on one of the following: • Shape [S] • Area [A] • Distance [D] • Direction [D] • This makes geographers and GIS experts very [SADD]… • There are names for the different classes of projections that minimize distortion. Those that minimize distortion: • in shape: conformal. • in distance: equidistant. • in area: equal-area. • in direction: true-direction. Projections
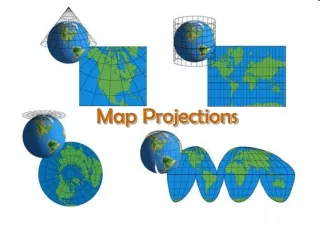
“A set of techniques developed by cartographers to depict with reasonable accuracy the spherical earth in two-dimensional media.” Cylindrical (regular or transverse) conic azimuthal The Flat Surface
The Mercator projection is also known as thecylindricalprojection and is shown in the illustration here. Note that it is as if a cylindrical piece of paper is wrapped around the globe. If a light bulb were inside the globe, the outlines of the continents and latitude and longitude lines will be "projected" onto the paper. You would then trace these lines and create the map when you open up the paper. It is important to see that where the paper is in contact with the globe the transfer of information to the map is very accurate. As the distance between the paper and the globe increases, the amount of distortion in the shapes of the landmasses also increases. Therefore, with the Mercator projection, the map is most accurate at the equator and the worst at the poles. Look how excessively large Antarctica is! • parallels and meridians are perpendicular on this map • best accuracy at equator, worst representation at the poles • map is used in navigation: straight lines on this map are rhumblines - lines of constant compass bearing (not the shortest route). Rhumb lines are also known as loxodromes. • Great circle routes (shortest route between two points) are curved on this map. Mercator
The Polar Projection (also known as the Plane or Gnomonic Projection). Produced by placing our piece of paper on either pole. • parallels are shown as circles around the pole • meridians are straight lines radiating from the pole like the spokes of a wheel • distorts near the equator • only shows one hemisphere at a time so if you want to show the entire world, you would need two maps • Great circle routes on this map are straight lines, rhumb lines are curved. Polar
The Conic Projection is centered on the mid-latitudes so there is least distortion there. Make a cone and place it on the globe. • parallels are curved • meridians appear straight and converge towards the pole • good map projection if you are going to show features in the mid-latitudes, like the United States. Conic
Different coordinate systems have different origins (0,0) • Different coordinate systems cover all or only part of the earth • Different coordinate systems have different units of measurement (e.g. feet, meters, degrees) A coordinate system is a means for identifying a point on the earth on a planimetric map. Coordinate Systems
Geographic Coordinate System (GCS); • map units in decimal degrees. • Universal Transverse Mercator (UTM); • map units in meters. • State Plane Coordinate System (SPCS); • preferred map units in U.S. Survey Foot. 3 Main Coordinate Systems
UTM provides georeferencing at high levels of precision for the entire globe • covers the entire earth in 60 zones, each 6 degrees wide • commonly used by environmental scientists, the military and other professions who need to work at the local level but also need their maps to coordinate with other areas on earth. • 80 degrees S to 84 degrees N used due to deviation on the two ends UTM
10 zones (10-19) cover the continental US • Each 6 degree zone is split in two: North Zone and South Zone • Origin (0,0) is at South West of each zone (avoids negative coordinates • UTM is measured in meters, i.e. how many meters east and north from origin? UTM (cont’d)
developed by the US Coast Guard and Geodetic Survey • used only in the US • about 120 zones to cover the entire United States • each zone has its own coordinate system • similar coordinate systems are used around the world SPCS
Wisconsin (left) has 3 zones • each zone has its origin (0,0) in the south west corner so that all coordinates in the zone have positive values • SPCS is measured in feet • a point is located based on how many feet east and north or origin • zones are defined by political boundaries State Plane Coordinate System (SPCS)
CALIFORNIA ZONE I FIPSZONE: 0401 UTM ZONE: 10 • DEL NORTE, HUMBOLDT, LASSEN, MODOC, PLUMAS, SHASTA, SISKIYOU, TEHAMA, TRINITY • CALIFORNIA ZONE II FIPSZONE: 0402 UTM ZONES: 10 & 11 • ALPINE, AMADOR, BUTTE, COLUSA, EL DORADO, GLENN, LAKE, MENDOCINO, NAPA NEVADA, PLACER, SACRAMENTO, SIERRA, SOLANO, SONOMA, SUTTER, YOLO, YUBA • CALIFORNIA ZONE III FIPSZONE: 0403 UTM ZONES: 10 & 11 • ALAMEDA, CALAVERAS, CONTRA COSTA, MADERA, MARIN, MARIPOSA, MERCED, MONO, SAN FRANCISCO SAN JOAQUIN, SAN MATEO, SANTA CLARA, SANTA CRUZ, STANISLAUS, TUOLUMNE • CALIFORNIA ZONE IV FIPSZONE: 0404 UTM ZONES: 10 & 11 • FRESNO, INYO, KINGS, MONTEREY, SAN BENITO, TULARE • CALIFORNIA ZONE V FIPSZONE: 0405 UTM ZONES: 10 & 11 • KERN, LOS ANGELES, SAN BERNARDINO, SAN LUIS OBISPO, SANTA BARBARA, VENTURA • CALIFORNIA ZONE VI FIPSZONE: 0406 UTM ZONE: 11 • IMPERIAL, ORANGE, RIVERSIDE, SAN DIEGO State Planes in California
Both based on zones • UTM zones follow lines of latitude and longitude • state plane zones generally follow political boundaries • UTM not as accurate as SPCS UTM vs State Plane
Everything in ArcGIS is based on an “X” and a “Y” • If your data does not have a defined projection, you can “define” it (but you need to know what it is!) • If your data has a different projection than your other data, you need to “project” it to one common projection • In other words… one project = one projection ArcGIS
The “Define Projection” tool: • Assign the correct projection to the data layer • ArcMap, select Catalog window > Toolboxes > System Toolboxes • The “Feature/Project” tool: • Creates a NEW copy of the data in the coordinate system you have selected ArcGIS
On-the-fly projection eliminates the need to change the projection of the data in ArcGIS A data frame’s projection can be pre-set by the user or ArcMap will default to the projection of the first layer added Projections in ArcGIS
DeMers, Michael N., 1997. Fundamentals of Geographic Information Systems. New York: John Wiley & Sons, Inc. • Krygier, John and Wood, Denis, 2005. Making Maps. New York: The Guilford Press. • http://krygier.owu.edu/krygier_html/geog_222/geog_222_lo/geog_222_lo13.html • Georeferencing, Projections. Retrieved from http://web.dcp.ufl.edu/junagoda/courses/urp-4273/lect_slides/week6.pdf. • http://www.manifold.net/index.html • http://web.gccaz.edu/~lnewman/gph111/topic_units/Systems_grid_proj/systems_time/index.html • Maher, Margaret M., 2010. Lining Up Data in ArcGIS. Redlands, California: ESRI PRESS. Sources