Download
1 / 29
290 likes | 483 Views
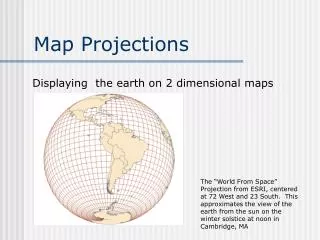
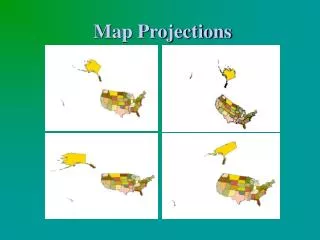
MAP PROJECTIONS. I. Creating a Map Projection II. Classifying Projections III. Putting Map Projections to Use. Tissot Indicatrix. Tissot Indicatrix. Scale Factor. Scale Factor = actual scale/nominal scale SF = 1.0 would indicate the scale on the projection is the same as the globe.

E N D
MAP PROJECTIONS I. Creating a Map Projection II. Classifying Projections III. Putting Map Projections to Use
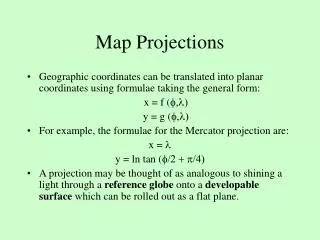
Scale Factor Scale Factor = actual scale/nominal scale SF = 1.0 would indicate the scale on the projection is the same as the globe. SF = 2.0 would indicate the scale on the projection is two times as large as the globe. SF = 0.75 projection scale is 25% smaller than the globe. The scale factor on any map is going to vary from point to point. No map has a uniform scale.
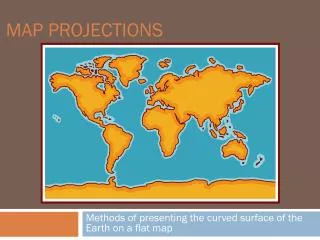
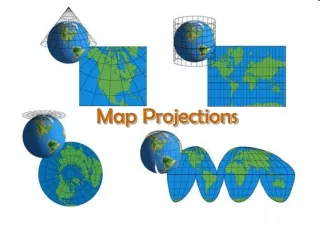
BASIC PROJECTIONS • There are three basic projections that are grouped into families: planar conic Cylindrical (pseudocylindric)
Tangent Secant
Tangent Secant
Tangent Secant
TRANSVERSE POLAR OBLIQUE OBLIQUE
PRESERVED PROPERTIES OF MAP PROJECTIONS DISTANCE (equidistant projections) SHAPE (conformal projections) DIRECTION (azimuthal projections) AREA (equivalent projections)
USE OF MAP PROJECTIONS WORLD PROJECTIONS • Equivalency is the overriding concern. Three accepted equal area projections: • Mollweide • Hammer • Boggs
MOLLEWEIDE world thematic distributions
HAMMER world distribution
BOGGS greater shape preservation at equator
ROBINSON best at equal-area
USE OF MAP PROJECTIONS CONTINENTS • In this case you are looking for either equivalence or conformality. • Bonne projection is commonly used to map continents on either side of the equator.
USE OF MAP PROJECTIONS Large & Small Countries at Mid-Latitudes • Most commonly used: • Bonne • Lambert equal area azimuthal • Albers equal area
OBLIQUE LAMBERT EQ. AREA AZIMUTHAL
USE OF MAP PROJECTIONS LOW LATITUDES • The following projections can be used along equatorial regions. • Mollweide • Hammer • Sinusoidal
USE OF MAP PROJECTIONS STATES IN THE UNITED STATES • The three conformal projections: • Lambert conformal conic--states with a long east-west dimensions (Tenn.) • Transverse Mercator--states with long north-south dimensions (Ca. or Fla.) • Oblique Mercator--generally used in Alaska