Download
1 / 33
350 likes | 545 Views
Map Projections. Geographic coordinates can be translated into planar coordinates using formulae taking the general form: x = f ( f,l) y = g ( f,l) For example, the formulae for the Mercator projection are: x = l y = ln tan ( f/2 + p/4)

E N D
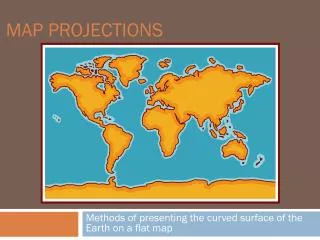
Map Projections • Geographic coordinates can be translated into planar coordinates using formulae taking the general form: • x = f (f,l) • y = g (f,l) • For example, the formulae for the Mercator projection are: • x = l • y = ln tan (f/2 + p/4) • A projection may be thought of as analogous to shining a light through a reference globe onto a developable surface which can be rolled out as a flat plane.
Graticules And Grids • The projected lines of latitude (parallels) and longitude (meridians) form a graticule. • Depending upon the type of developable surface, the source of the light and other factors, the lines in a graticule may be equally or unequally spaced, parallel or converge, straight or curved. • For medium and large scale maps, a rectangular coordinate system, known as a grid, is often superimposed for the purpose of providing grid references, etc.
Distortions • All projections involve disotrtions. • There are four properties one might wish to preserve: • Shape • Area • Distance • Direction • Whilst a projection may be able to preserve some of these properties, this will be at the expense of other properties.
Map Scale • The scale of a projected map may be thought of as having two components: • Principal scale. The ratio of the size of the reference globe to the Earth. • Scale factor. The ratio of the size of a feature on the projected map to its size on the reference globe. • The scale factor is often different in the x and y directions, and often varies throughout the map. It can be thought of as a measure of local distortion (1.0 = no distortion).
Scale Factor And Properties • The relationship between the scale factor in the x and y directions (sx and sy) provides a more precise understanding of the four properties we might wish to preserve. • We will look at each of these in turn.
Shape • A conformal (or orthomorphic) map preserves the shape of features at local level (e.g. Lambert Conformal Conic, Mercator). • To do this the projected map must preserve the angle between parallels and meridians (i.e.90 degrees). • The Mercator projection uses straight parallel lines for both parallels and meridians. However, in the real world the meridians converge at the poles. • The space between the meridians must therefore be stretched in the projected map to remain parallel.
Shape (2) • To retain the correct shape, the space between the parallels must also be stretched by the same amount (i.e. the parallels or lines of latitude become further apart as you move toward the poles). • In other words, sx must be equal to at sy at all points on the map. • Other conformal projections use curved lines, but the basic principles are the same. • sx and sy obviously change as you move around the map. • One implication is that although you can preserve shape at local level, it is impossible to preserve overall shape.
Area • Equal area (or equivalent) projections (e.g. Albers Equal Area Conic; Equal Area Cylindrical) attempt to preserve the relative size of features on the map. • To preserve area, if the scale is stretched in one direction, then it must be reduced by a corresponding amount in the other directions. • In other words: sx . sy = 1.0 • Not that to preserve area we must by necessity distrort shape (and vice versa).
Distance • Equidistant projections (e.g. Equidistant Azimuthal, Sinusoidal) attempt to minimise distortions in measures of distance between points. • There are two approaches: • Accurate distance measures are preserved along one (or sometimes two) lines of latitude (standard parallels). Distortions increase as you move away from these lines. • Accurate distance measures may be preserved in all directions from one (or possibly two) points. • No map can preserved accurate distance measures for every direction from every point on the map.
Direction • Azimuthal projections (e.g. Lambert Equal Area Azimuthal, Equidistant Azimuthal) preserve direction (e.g. for navigation purposes). • However, they are only accurate for one or two selected points. • The Mercator projection preserves the correct compass bearing between any two points, but does not indicate the shortest route.
Compromise Projections • Some projections (e.g. Robinson) attempt to minimise the distortions in all properties without being accurate in any one of them.
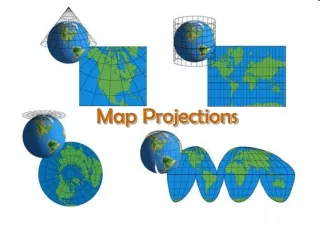
Projection Types • Different projections have different properties. • Projections vary in how they are constructed. • One important difference is the type of devlopable surface: • conic • cylindrical • Planar • A second consideration is whether the developable surface is tangential (just touching) or secant (intersecting). • Points / lines of tangency / secancy are significant because they imply no distortion.
Conic Projections (1) • The developable surface in a conic projection forms a sort of dunce’s cap. • The cone is converted to a planar surface by metaphorically cutting it and spreading it flat. • The line directly opposite the cut is referred to as the central meridian. • The line of tangency is referred to as the standard parallel. This has no distortion. Distortions increase as you move away from the standard parallel. • The distortions at the poles are so large that the top is usually ‘chopped off’.
Conic Projections (2) • Secant conic projections produce two lines of secancy (i.e. two standard parallels). • The distance between the standard parallels depend on how far down the cone is ‘pushed’. • Distortion is minimalised at the standard parallels, and is fairly small between them if they are not too far apart.
Conic Projections (3) • The meridians converge towards a point, whilst the parallels are curved. However, this may be disguised by the superimposition of a rectangular Cartesian grid for large scale maps. • The spacing between the parallels can be adjusted by moving the light source closer or further away. • Equidistant Conic projections, which may be either tangential or secant, have evenly spaced parallels, which means the projection is equidistant in a north-south direction (i.e. the meridians), but it is neither conformal nor equal-area.
Conic Projections (4) • The Lambert Conformal Conic projection is a secant projection designed to preserve shape. It is characterised by an increasing distance between parallels as you move towards the top or bottom of the map. • The Albers Equal-Area Conic projection is also a secant projection, but the objective in this case is to accurately represent areas. Shape is only distorted slightly between the central parallels, but the distortion increases towards the top and bottom of the map. The parallels between the standard parallels are more widely spaced than those at the top or bottom.
Cylindrical Projections (1) • Cylindrical projections may either have one line of tangency or two of secancy. • The projection may be normal (using lines of latitude as the lines of contact - e.g. Mercator), transverse (using meridians - e.g. Transverse Mercator) or oblique (using any other great circle line).
Cylindrical Projections (2) • The Mercator projection is probably the best known projection of all. • It produces a graticule with 90 degree angles. The meridians are equally spaced, whilst the spacing of the parallels (i.e. lines of latitude) increases towards the poles. • The Mercator projection preserves direction, but results in massive distortions of some of the other properties (especially area in the polar regions).
Cylindrical Projections (3) • The Universal Transverse Mercator (UTM) is a transverse projection. • The world is divided into 60 zones with central meridians at 6 degree intervals. The zones start at 180 degrees West, and the zone numbers rise as you travel east. Ireland is in zone 29 and Britain is in zone 30. • Each zone between 84° N and 80° S is divided into 20 bands of 8 degrees each, except for the most northerly one which is 12 degrees (i.e. a total of 60x20=120 ‘regions’). • Two lines of secancy run parallel to and approximately 180 km on either side of the central meridian.
Cylindrical Projections (4) • The scale factor along these lines is 1.0, but is 0.9996 along the central meridian and 1.0004 on either edge of the zone. • The UTM is aconformal projection. • Lines of latitude and longitude both appear curved in the projection, except for the central meridian and the equator. • The coordinates are expressed in metres. The origin is the intersection of the central meridian and the equator, but the origin is given a false easting of 500,000. • In the southern hemisphere the origin is given a false northing of 10,000,000. The x coordinates have 6 digits, but the y coordinates have 7 digits.
Planar Projections (1) • Planar projections, sometimes referred to as azimuthal or zenithal projections, project map data onto a flat surface which normally touches the globe at a single point. • The point of contact defines the aspect of the projection. The aspect can be polar (using either the north or south pole), equatorial (using a point somewhere on the Equator) or oblique (using any other point).
Planar Projections (2) • Planar projections provide accurate representations of direction from their focus (i.e. point of contact), where the graticular angles are correctly represented as 90 degrees, but not from any other point. • Areal and conformal distortion increases with increasing distance from the focus, so planar projections are best suited for displaying circular regions (e.g. the poles). • The graticule has a dartboard pattern.
Planar Projections (3) • The spacing between the lines of latitude depends upon the location of the hypothetical light source. • Gnomonic projections view the surface data from the centre of the Earth, stereographic projections view the data from the point on the Earth's surface directly opposite the point of contact, and orthographic projections view the data from a point at infinite distance (analogous to a very distant planet).
Other Projections • Modified projections use various mathematical devices to modify one of the standard projections to reduce distortion (e.g. Space Oblique Mercator). • Pseudo projections are totally artificial. • For example, the Sinusoidal projection is a pseudocylindrical projection which preserves area, but distorts shape away from the central meridian and the equator. • The Robinson projection is also a pseudocylindrical projection which does not accurately preserve any properties, but it results in only minimal distortions in both shape and area in the central parts of the map.
National Grids (1) • The UTM is conformal (i.e. preserves local shape) and is suitable for medium scale mapping in most areas • Many national mapping agencies have adopted a coordinate system which is particularly suited to their own local conditions (e.g. shape, latitude, etc.). • For example, a Transverse Mercator would not be suitable for Canada, because of its large east-west extent, therefore Canada uses a Lambert Conformal Conical projection which is especially suitable for mid to high latitudes.
National Grids (2) • In the US, each state adopted its own projection and coordinate system in the 1930s, referred to as State Plane Coordinates (SPC). • Some of the larger states are further subdivided into zones for greater accuracy. Texas, for example, is divided into five ‘horizontal’ zones, each of which use a Lambert Conformal Conical projection. Hawaii is also divided into 5 zones, but they are ‘vertical’ and are based on a Transverse Mercator projection. • The SPCs had to be revised following the adoption of the North American Datum in 1983 (NAD83).
National Grids (3) • The ‘traditional’ British and Irish national grids use Transverse Mercator projections, but with a different central meridian and a different spheroid. • The Irish Grid was based on a modified Airy spheroid, whereas the British grid used an unmodified Airy spheroid. • Ordnance Survey Ireland defined a new coordinate system in 2001, referred to as ITM (Irish Transverse Mercator), to be more compatible with GPS. This is based on the GRS80 spheroid, but it uses the same origin as the Irish Grid. • As the coordinates would have been similar, but not identical, the false origin in ITM was shifted further into the Atlantic to avoid possible confusion.