Download
1 / 16
160 likes | 259 Views
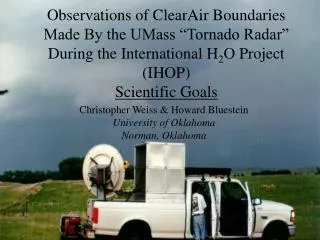
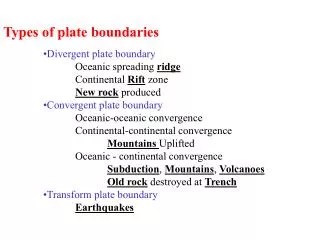
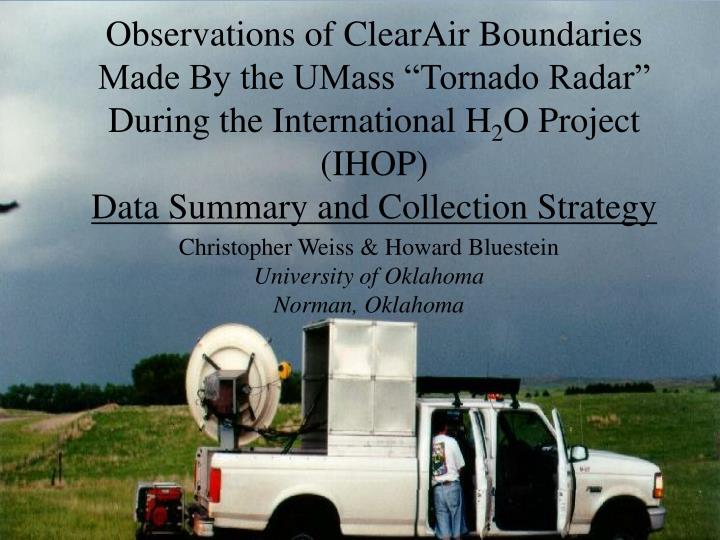
Observations of ClearAir Boundaries Made By the UMass “Tornado Radar” During the International H 2 O Project (IHOP) Data Summary and Collection Strategy. Christopher Weiss & Howard Bluestein University of Oklahoma Norman, Oklahoma. Radar Spec Basics. Boresighted camera on dish (calibrated)

E N D
Observations of ClearAir Boundaries Made By the UMass “Tornado Radar” During the International H2O Project (IHOP) Data Summary and Collection Strategy Christopher Weiss & Howard Bluestein University of Oklahoma Norman, Oklahoma
Radar Spec Basics • Boresighted camera on dish (calibrated) • Operating frequency = 95 GHz (l=3 mm) • Beamwidth = 0.18 degrees • Three experimental modes for clear-air:
Operations During IHOP_2002 June 9 (dryline) June 10 (dryline) June 3 (cold front) Deployments: 3 rolling RHI 2 stationary RHI 2 VAD Deployments: 2 rolling RHI 2 VAD Deployments: 1 stationary RHI May 22 (dryline) Deployments: 4 rolling RHI 2 stationary RHI 2 VAD 1 vertical antenna X-sect
Data Collection StrategiesMode #1 - VAD 5/22/02 – moist side VAD • Synthesize vertical wind profile from elevated sector scan (~ 220 degrees in azimuth, at 45 degrees elevation) • Six VADs performed during IHOP, three on each side of the dryline. W
Data Collection StrategiesMode #2 – Vertical Antenna • Temporal/spatial profile of vertical velocity • Performed on May 22 dryline
Data Collection StrategiesMode #3 – Stationary RHI • Five such deployments during IHOP • Drawback: No Vr decomposition into u/w • Vertical sectors perpendicular to feature of interest • May 22 - Dryline retrogrades through truck • June 9 – Dryline advances past truck
DZ Dryline Retrogression 5/22/02 W 00:36 UTC (5/23) VE
DZ Dryline Retrogression 5/22/02 W 00:37 UTC (5/23) VE
DZ Dryline Retrogression 5/22/02 W 00:43 UTC (5/23) VE
DZ Cold Front 6/3/02 NW 19:49 UTC VE
DZ Cold Front 6/3/02 NW 19:51 UTC VE
DZ Cold Front 6/3/02 NW 19:56 UTC VE
Data Collection StrategiesMode #4 – Rolling RHI • Nine rolling RHIs during IHOP (all across drylines) • GPS data critical • Use pseudo-dual Doppler principles for u/w decomposition in lobe but…more complicated than airborne technique.
Dryline 5/22/02 DZ 00:30 UTC (5/23) W
DZ Dryline 6/10/02 E 20:00 UTC VE (uncorrected)
Complications • Subtraction of truck velocity is delicate. • Accurate GPS position, velocity important • Pitch of truck • Uncertainty of GPS elevation data • Translation and development of feature • “Stationarity assumption” • Uncertain boundary positions • Sensitivity and range • Irregular weave pattern (i.e., varying angle of intersection between two radar looks)