Download
1 / 45
450 likes | 463 Views
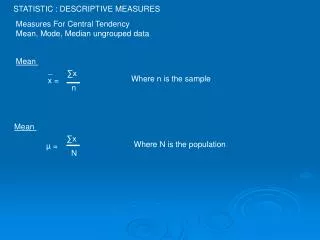
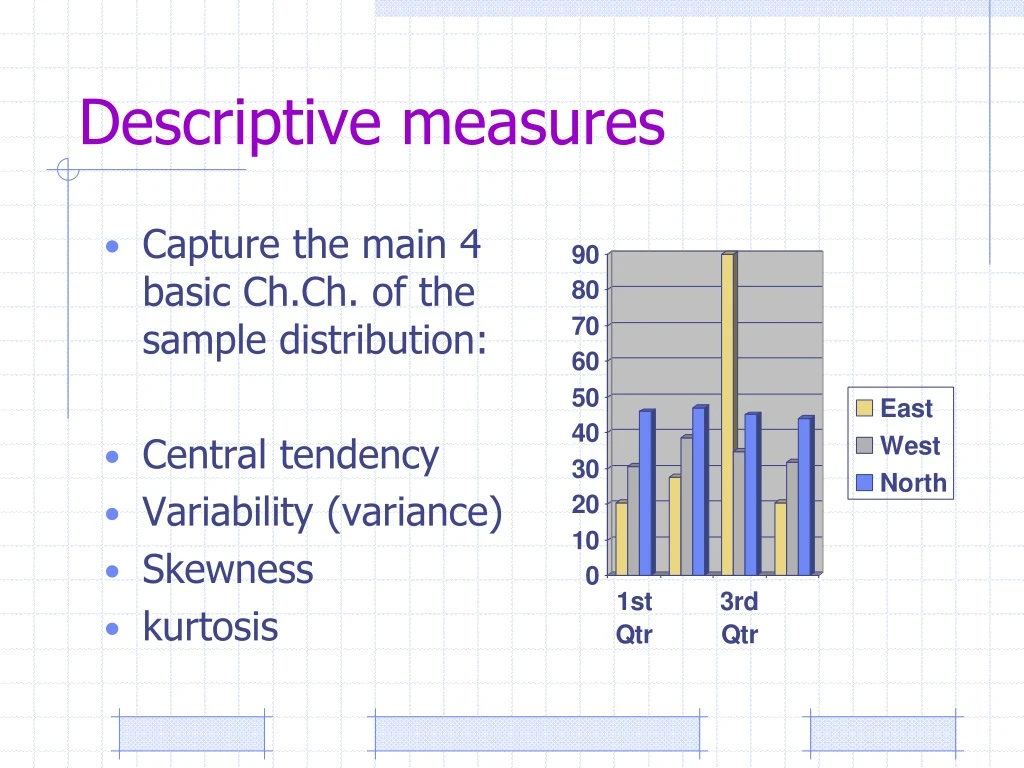
Descriptive measures. Capture the main 4 basic Ch.Ch. of the sample distribution: Central tendency Variability (variance) Skewness kurtosis. Measures of central tendency MEAN. M = ∑ X/N

E N D
Descriptive measures • Capture the main 4 basic Ch.Ch. of the sample distribution: • Central tendency • Variability (variance) • Skewness • kurtosis
Measures of central tendencyMEAN • M = ∑ X/N • It is the best average for symmetrical frequency distributions that have a single peak, (normal distribution).
Measures of central tendencyMEAN (Ch.Ch of the mean) • The sum of deviations of the values from the mean always = Zero.
∑ (X – M)² (THE SUM OF SQUARES) is smaller than the sum of squares around any other value. (least squares). • A mean of total group (M total = M1n1 + M2n2 + ……..)
Mean is intended mainly for interval and ratio variables and some times in ordinal variables, but not in nominal ones such as the mean of gender = 0.75.
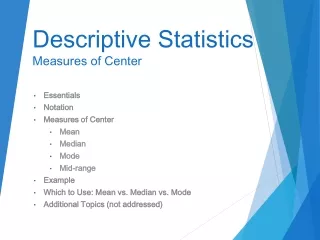
Measures of central tendencyMedian • The middle value of a set of ordered numbers • 50th. percentile
Measures of central tendencyMedian • The median is not sensitive to extreme scores (e.g. 8, 10, 10, 18, 24, 29, 36, 48, 60, 224) • Used in symmetrical and a symmetrical distributions
Measures of central tendencyMedian • It is useful when the data are skewed • Appropriate in ratio, interval and ordinal variables, but not for nominal data.
Measures of central tendencyMode • The most frequent value or category in a distribution • Not calculated, but spotted • E.g. 8, 10, 10, 18, 24, 36, 48, 60 the mode is 10 • It is appropriate for all variables including the nominal ones.
Comparison of Central Tendency Measures • In a perfect world, the mean, median & mode would be the same. • However, the world is not perfect & very often, the mean, median and mode are not the same
Central Tendency - Graphed MEAN MODE MEDIAN
Summary for central tendency measures • Use mean as more frequent unless the distribution is badly skewed (median) • Use mode for nominal variables • If the mean is greater than median, the distribution is positively skewed.
Mean Mean Mean Median Mode Mode Mode Median Median Symmetric (Not Skewed) Positively Skewed Negatively Skewed
Comparison of Central Tendency Measures • Use Mean when distribution is reasonably symmetrical, with few extreme scores and has one mode. • Use Median with nonsymmetrical distributions because it is not sensitive to skewness. • Use Mode when dealing with frequency distribution for nominal data
Measures of variability, scatter or dispersion (SD) • SD = square root of ∑ (X – M)² /n – 1 • Every value in the distribution entered in calculation of SD. • SD is a measure of variability around the mean. • It is sensitive to extreme values • It serves best in normally distributed populations
Measures of variability, scatter or dispersion (Range) • The difference b/w the maximum and the minimum values in a distribution • Sensitive to extreme values
Measures of variability, scatter or dispersion (percentile) • Is a score value above which and below which a certain percentage of values in a distribution fall. • P60 = 30 means that 60% of the values in the distribution fall below the score 30.
Measures of variability, scatter or dispersion (percentile) • It allows to describe a score in relation to other scores in the distribution. • 25th. percentile = first quartile • 50th.percentile = second quartile (median) • 75th. percentile= third quartile
Comparison of Measures of Variability Standard Deviation • Most widely used measure of variability • Most reliable estimate of population variability • Best with symmetrical distributions with only one mode
Comparison of Measures of Variability Range • Main use is to call attention to the two extreme values of a distribution • Quick, rough estimate of variability • Greatly influenced by sample size: the larger the sample, the larger the range
Comparison of Measures of Variability Interpercentile Measures • Easy to understand • Can be used with distributions of any shape • Especially useful in very skewed distributions • Use IQR when reporting median of distribution
Summary of variability measures • SD the most frequently used measure (normal curve = one mode) • Range is a rough estimate of variability (influenced by sample size) • Range and percentiles are useful in skewed distributions. • There are no measures of variability for nominal variables.
Shape of the Distribution • The shape of the distribution provides information about the central tendency and variability of measurements. • Three common shapes of distributions are: • Normal: bell-shaped curve; symmetrical • Skewed: non-normal; non-symmetrical; can be positively or negatively skewed • Multimodal: has more than one peak (mode)
Variable Distribution Symmetry • Normal Distribution is symmetrical & bell-shaped; often called “bell-shaped curve” • When a variable’s distribution is non-symmetrical, it is skewed • This means that the mean is not in the center of the distribution
Skewness • Skewness is the measure of the shape of a nonsymmetrical distribution • Two sets of data can have the same mean & SD but different skewness • Two types of skewness: • Positive skewness • Negative skewness
Mean Mean Mean Median Mode Mode Mode Median Median Symmetric (Not Skewed) Positively Skewed Negatively Skewed Relative Locations for Measures of Central Tendency
Positive Skewness • Has pileup of cases to the left & the right tail of distribution is too long
Negative Skewness • Has pileup of cases to the right & the left tail of distribution is too long
Measures of Symmetry • Pearson’s Skewness Coefficient Formula = (mean-median) SD • Skewness values > 0.2 or < 0. 2 indicate severe skewness
Measures of Symmetry • Fisher’s Skewness Coefficient Formula = Skewness coefficientNB Standard error of skewness • Skewness values >+1.96 SD indicate severe skewness NB: Calculating skewness coefficient & its standard error is an option in most descriptive statistics modules in statistics programs
A measure of skewness is Pearson's Coefficient of Skew. It is defined as: Pearson's Coefficient = 3(mean - median)/ standard deviation
Data Transformation • With skewed data, the mean is not a good measure of central tendency because it is sensitive to extreme scores • May need to transform skewed data to make distribution appear more normal or symmetrical • Must determine the degree & type of skewness prior to transformation
Data Transformation • If positive skewness, can apply either square root (moderate skew) or log transformations (severe skew) directly • If negative skewness, must “reflect” variable to make the negative skewness a positive skewness, then apply transformations for positive skew
Data Transformation • Reflecting a variable change in the meaning of the scores. • Ex. If high scores on a self-esteem total score meant high self-esteem before reflection, they now mean low self-esteem after reflection
Data Transformation • As a rule, it is best to transform skewed variables, but keep in mind that transformed variables may be harder to interpret • Once transformed, always check that transformed variable is normally or nearly normally transformed • If transformation does not work, may need to dichotomize variable for use in subsequent analyses
Kurtosis A measure of whether the curve of a distribution is: • Bell-shaped -- Mesokurtic • Peaked -- Leptokurtic • Flat -- Platykurtic
Fisher’s Measure of Kurtosis • Formula = Kurtosis coefficientNB Standard error of kurtosis • Kurtosis values >+1.96 SD indicate severe kurtosis NB: Calculating kurtosis coefficient & its standard error is an option in most descriptive statistics modules in statistics programs
Practice exercises on skewness and kurtosis Histograms Bar Charts Box plots Scatter plots Line charts