Download
1 / 43
430 likes | 571 Views
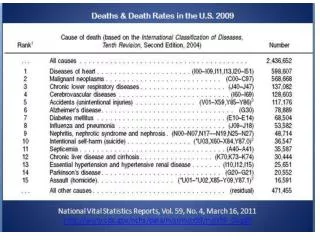
Predicting risk of cardiovascular disease and the cost-effectiveness of interventions in Thailand Stephen Lim On Behalf of the Setting Priorities using Information on Cost-Effectiveness (SPICE) Project. MALE. FEMALE. Rank. Disease category. DALYs. %. Disease category. DALYs. %. 1.

E N D
Predicting risk of cardiovascular disease and the cost-effectiveness of interventions in Thailand Stephen Lim On Behalf of the Setting Priorities using Information on Cost-Effectiveness (SPICE) Project
MALE FEMALE Rank Disease category DALYs % Disease category DALYs % 1 HIV/AIDS 960,087 17% HIV/AIDS 372,947 9% 2 Traffic accidents 510,907 9% Stroke 280,673 7% 3 Stroke 267,567 5% Diabetes 267,158 7% 4 Liver cancer 248,083 4% Depre ssion 145,336 4% 5 Diabetes 168,372 3% Liver cancer 118,384 3% 6 Ischaemic heart disease 164,094 3% Osteoarthritis 117,994 3% 7 COPD (emphysema) 156,861 3% Traffic accidents 114,963 3% 8 Homicide and violence 156,371 3% Anaemia 112,990 3% 9 Suicides 147,988 3% Ischaemic heart disease 109,592 3% 10 Drug dependence/harmful 137,703 2% Cataracts 96,091 2% use Top Ten Causes of Disability Adjusted Life Year (DALYs) by Sex, Thailand 1999
Prevention of CVD • 2 different but complementary approaches to prevention: • Population-wide approach – aims to reduce levels of risk factor(s) across the whole population • High risk approach – targets prevention towards those who are at higher risk, e.g. high blood pressure, high cholesterol
Targeting high-risk • How do we target those at high risk? • Traditionally, by thresholds of individual risk factors, e.g. systolic blood pressure ≥ 140mmHg (hypertension) • More recent approach uses absolute risk of CVD in, e.g. next 10 years • E.g. using risk prediction equations from the Framingham study
Absolute risk • Absolute risk of CVD takes into account • Multiple risk factors determine CVD risk • age, sex, blood pressure, cholesterol, smoking, diabetes, etc
Absolute risk • Absolute risk of CVD takes into account • Multiple risk factors determine CVD risk • age, sex, blood pressure, cholesterol, smoking, diabetes, etc • Continuous measurements of risk factors • e.g. relationship between blood pressure and CVD is not dichotomous (i.e. having hypertension or not having hypertension) but is continuous
Absolute risk • Absolute risk of CVD takes into account • Multiple risk factors determine CVD risk • age, sex, blood pressure, cholesterol, smoking, diabetes, etc • Continuous measurements of risk factors • e.g. relationship between blood pressure and CVD is not dichotomous (i.e. having hypertension or not having hypertension) but is continuous • An individual with moderately elevated levels of multiple risk factors may be at higher risk than an individual with high levels of a single risk factor
Risk prediction equations • Determination of absolute risk is based on cohort studies examining the relationship between risk factors and CVD outcomes • Uses survival analysis (Cox regression or Weibull models) to determine predictive risk equation • Many of the risk equations in use are based on the Framingham study • These have been validated and “adjusted” for use in other cohorts and settings, e.g. China, Australia, Europe, New Zealand
Risk prediction equations • The Electricity Generating Authority of Thailand (EGAT) cohort study provides important information on the relationship between risk factors and CVD outcomes in a Thai population • 3,499 employees of EGAT (2,702 males, 797 females) aged 35-54 years • Physical examinations (including blood) 1985, 1997, 2002 • Information on a range of fatal and non-fatal CVD events • 2nd cohort of individuals followed from 1997
Risk prediction equations • EGAT: • Developed a range of risk prediction equations Coronary Heart Disease (CHD), Diabetes • Equations used to develop a point score system for predicting absolute risk • Validation of other risk prediction equations from the Framingham study and China cohorts • Show, like other studies, that Framingham equations predict relative risk well, but overestimate absolute risk
EGAT-SPICE collaboration • Use EGAT equations to determine predicted CHD risk for individuals in the National Health Examination Survey 3
Cox proportional hazards model from EGAT • 2418 subjects, 74 CHD events Developed by Dr Sukit
Apply EGAT score to NHES 3 • Using raw data from NHES • No sample weights • Not yet cleaned • Apply to males aged 35-59 only • Excluding HDL as this is not measured • Some inconsistencies between EGAT and NHES risk factors definitions • NHES: Alcohol in last 12 months • EGAT: Current alcohol use
Apply EGAT score to NHES 3 • Cox-proportional harzards model was used to determine individual risk Risk estimate = 1 – S0(t)exp(∑βX- ∑βX) where, S0(t) is the average survival time at time t β’s are the Cox-regression coefficients X are the individual RF values X are the mean RF values
Apply EGAT score to NHES 3 • For male aged 55, SBP 160, Chol 250mg/dl, diabetic, smoker, waist 102cm, no alcohol • ∑βX = age*0.07185 + sbp*0.01958 + Tch*0.00491 + diabetes*0.81009 + smoke*0.60459 -alcohol*0.92253 + waist90*0.75886 • ∑βX = 55*0.07185 + 160*0.01958 + 250*0.00491 + 1*0.81009 + 1*0.60459 - 0*0.92253 + 1*0.75886 = 10.485 • S0(10) from Kaplan-Meier estimate from EGAT is 0.9891 • ∑βX is 7.78547 • Risk estimate = 1 – 0.9891exp(10.485-7.78547) =0.1504 15% risk of CHD event over the next 10 years
Overall predicted 10-year CHD risk • Predicted risk of CHD lower in NHES 3 (0.62% compared with 1.09% from EGAT) Preliminary analysis – Please do not quote
Comparison of mean RF values Preliminary analysis – Please do not quote
Ongoing work • Repeated measures analysis • Currently using only 1985 examination with 17 year follow-up • Repeated measures allows us to use 1997, 2002 examination also • Causal web estimation using hierarchical models
Risk prediction equations • Limitations • Males aged 35-59 - not sufficient numbers to generate risk equation for women • Time period is 1985-2002 • Risk of CVD in this period may be quite different from risk of CVD today • Alternative approach is to calibrate Framingham risk prediction equations for use in Thailand
Calibration of absolute risk Risk factor prevalence data e.g. from NHES3 Population estimates of disease incidence, e.g. from Thai BOD + + Framingham Risk prediction Absolute risk specific to the population Adjusted for local risk factor prevalence and underlying risk
Example Female, 55 years, total cholesterol 6.7, no diabetes, current smoker, SBP 140mmHg Framingham 1-year CHD risk for this individual is 0.034 Framingham 1-year CHD risk for NHES females aged 55 is 0.007 Risk for this individual relative to all Thai females aged 55: 0.034 = 4.70 RR = 0.007 Population-level incidence of CHD for females aged 55 is 0.0051 Individual calibrated CHD risk is 4.7 * 0.0051 = 0.024 In other words, this individual has a 2.4% chance of having a CHD event in the next year
Risk prediction • Approach adjusts for: • Risk factor prevalence (NHES) • Underlying risk of CVD (population-level incidence of CVD from Thai BOD) • Underlying assumption is that relative risk of risk factors is the same across the two populations • Supported by EGAT data for males
Issues for CVD prevention • Many different strategies exist for reducing the risk of CVD • How can we target high-risk individuals? • Traditional approach using thresholds of individual risk factors, e.g. systolic blood pressure ≥ 140mmHg • Absolute risk approach takes into account multiple risk factors e.g. age, sex, blood pressure, cholesterol, smoking, diabetes • Should a cholesterol test be included to identify high-risk individuals?
Issues for CVD prevention • Due to these difficulties, it is likely that the large amount of resources that are devoted to preventive strategies for CVD are not being used in an optimal manner. • Cost-effectiveness analysis can tell us which interventions are optimal given currently available resources • Which mix of strategies is most efficient in reducing the burden of CVD?
Modelling cost-effectiveness • Rely on state transition (“Markov”) models • Portions of a cohort move through different mutually exclusive states over time • Movement between states is determine by transition probabilities • Model the current Thai population in terms of CVD outcomes over time
Modelling cost-effectiveness DEAD ALIVE CHD Year 0 Year 1 Year 2
Modelling cost-effectiveness • Transition probabilities for CVD can be determined in a similar way to calibration of CVD absolute risk equations • Allows us to simulate individuals with different risk factor profiles / absolute risk through the state transition model
Modelling cost-effectiveness • Repeat process under “no intervention” and “intervention” scenarios • e.g. statins may reduce the transition between ALIVE and CHD by 30% • Can then determine • health years gained by the intervention • cost of interventions • potential cost savings due to reduced cases of CVD • Cost-effectiveness
Natural history of CVD • Model structure depends on natural history of the disease being modelled • 2 major types of CVD events • Acute coronary syndromes (ACS), including myocardial infarction and unstable angina pectoris • Major sequelae are angina and heart failure • Stroke including both hemorrhagic and ischemic sub-types • Multiple risk factors for both ACS and stroke • Age, sex, blood pressure, cholesterol, diabetes, etc
Natural history of CVD • Prognosis of both ACS and Stroke are similar • (very) high case-fatality in first 28-days • risk of mortality in 28-days survivors remains elevated thereafter • Need to differentiate between initial mortality (first 28-days or first year) and risk of mortality thereafter
CVD model structure T1 T3 T5 T7 T4
Data sources • EGAT • Incidence:mortality ratios • Some information on case-fatality rates • Risk prediction equation • Vital registration with cause of death corrections • Mortality from CVD • National Health Examination Survey • Self-reported prevalence of CHD and stroke • Risk factor prevalence • ACS and Stroke registries • In-hospital case fatality • Major limitation is lack of information on out-of-hospital case-fatality
Reasons for inefficiency of current practice in Australia • Absolute risk vs Risk factor thresholds • Not enough attention to lifestyle and public health interventions • Community programs • Dietary counselling • Phytosterol supplementation • Current resources directed at less efficient classes of BP lowering drugs • e.g. ACE inhibitors
Summary • There is potential to increase the efficiency of CVD prevention efforts with : • The development of robust tools to predict absolute risk of CVD in clinical practice • Estimates of the cost-effectiveness of different prevention strategies