Download
1 / 12
120 likes | 230 Views
OnTheMap Yes, the data are complex. really cool. Yes, we have a tool for that. web-based. powerful. free. mapping. simple. convenient. web-based. free. mapping. simple. convenient. web-based. fast. fast. powerful. powerful. free. mapping. simple. convenient. fast.

E N D
OnTheMapYes, the data are complex. really cool Yes, we have atool for that. web-based powerful free mapping simple convenient web-based free mapping simple convenient web-based fast fast powerful powerful free mapping simple convenient fast Matthew Graham Geographer Center for Economics Studies U.S. Census Bureau
An Administrative Data Product Longitudinal Employer-Household Dynamics (LEHD) Program Partnership with States Combined existing administrative data and census/survey data to produce new knowledge about jobs, firms, and workers.
Data Infrastructure • Very large dataset: • 130 million jobs each quarter • About 94% of US jobs • Cutting edge confidentiality protection approved by the Census Bureau’s Disclosure Review Board • Noise Infusion • Imputation • Synthetic Data Methods
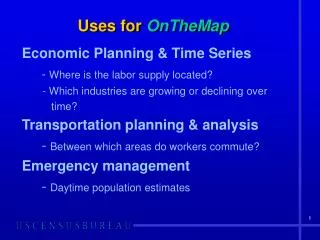
LEHD’s Public-Use Data Products • Quarterly Workforce Indicators (QWI) • 30 job-based indicators (e.g. New Hires) • State, county, metropolitan/micropolitan areas • Age, ownership, race, ethnicity, education, industry, firm age, firm size breaks • LEHD Origin-Destination Employment Statistics (LODES) • Home-Work relationships • Census block-based (11.1 million census blocks) • Age, ownership, earnings, industry, sex, race, ethnicity, education
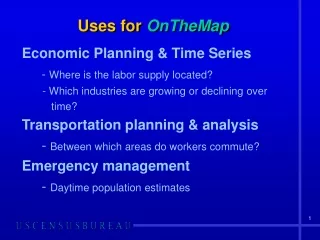
OnTheMap • A free, online, mapping tool for analyzing the LODES data. • Basic Goals: • Promote the use of the LODES data • Promote exploration of the data’s spatial dimensions • Create a simple, easy-to-use interface • Show results (maps, tables, visualizations) that provide insight on economic questions.
Motivations The idea is to enable users to manipulate the data in a way that allows them to ask questionsand answer them and then promote the asking of new questions. We want users to be able to view the data from many different frames of reference in order to generate new insights.
A Scale Example ofPopulation Density in DC Base Map Country State Ward Tract Blockgroup 450 rows Block 6507 rows
Demonstration http://onthemap.ces.census.gov/
Design Approach Clear, limited goal: What is this tool? What isn't it? Tight design and development process Talented team Input from prospective users and data experts Focusing on the goal and not the pathway Continual Improvement: 6 versions in 6 years
Continual Improvement Allowing goals to evolve Open ended development process Live/die by performance Usability can always be improved
Also Worth Mentioning • Spinoffs • OnTheMap for Emergency Management • OnTheMap Mobile • In The Future • Data Cutting Tools (QWI and LODES) • QWI Explorer • Job-to-Job Flows
Contacts • OnTheMap • http://onthemap.ces.census.gov • LEHD Program • http://lehd.ces.census.gov • Questions • CES.OnTheMap.Feedback@census.gov • matthew.graham@census.gov